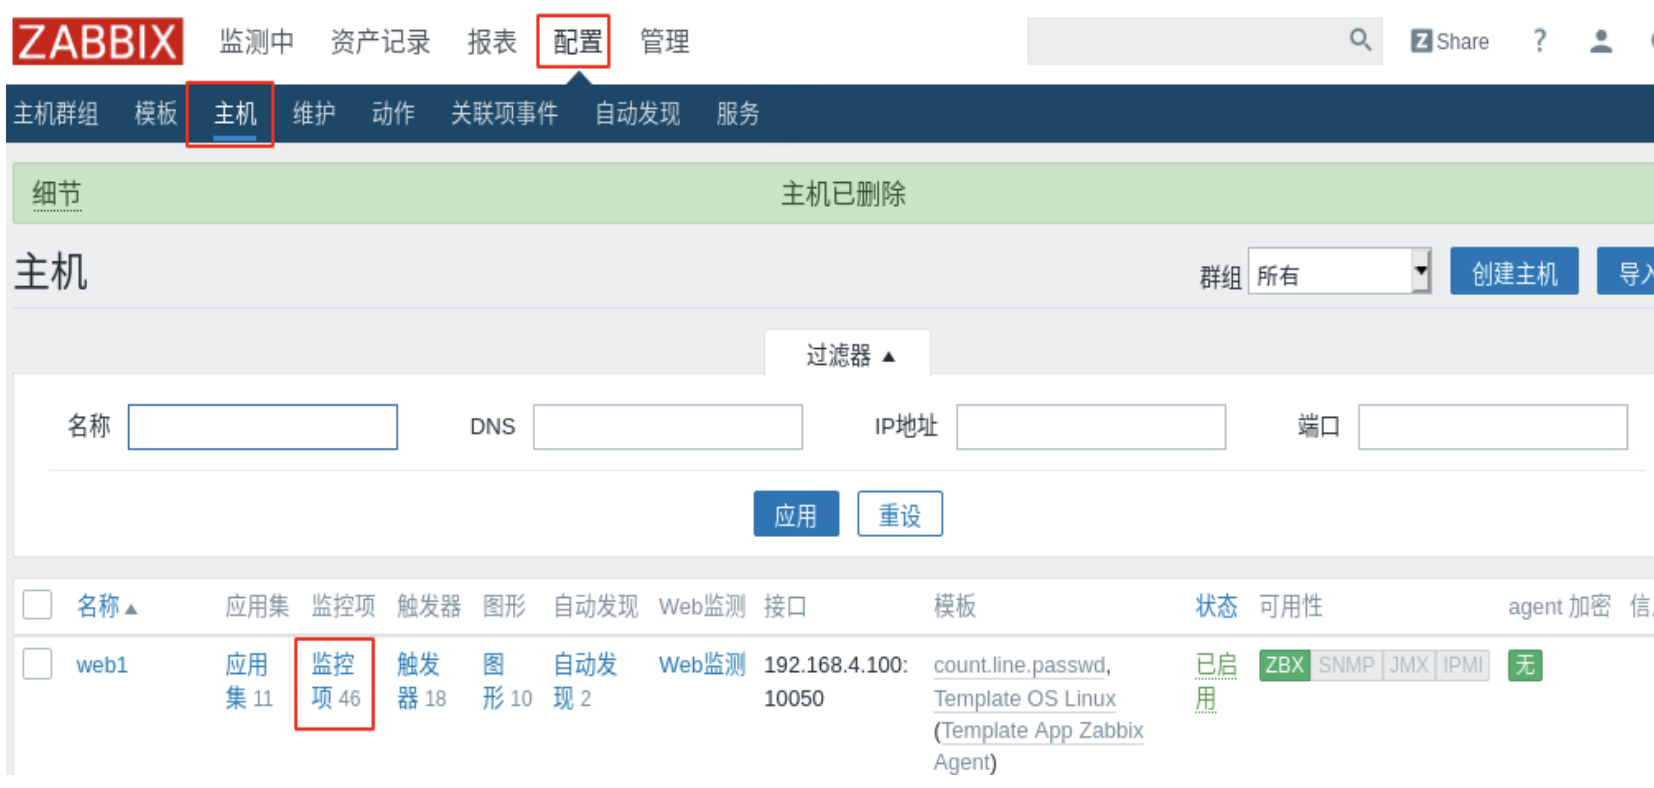
监控nginx示例
stub_status模块
用于实时监控nginx的网络连接,这个模块是nginx官方提供的一个模块。
# 编译nginx,支持stub_status模块
[root@zzgrhel8 ~]# scp /linux-soft/2/lnmp_soft.tar.gz 192.168.4.100:/root
[root@web1 ~]# tar xf lnmp_soft.tar.gz
[root@web1 ~]# cd lnmp_soft/
[root@web1 lnmp_soft]# yum install -y gcc pcre-devel openssl-devel
[root@web1 lnmp_soft]# tar xf nginx-1.12.2.tar.gz
[root@web1 lnmp_soft]# cd nginx-1.12.2/
[root@web1 nginx-1.12.2]# ./configure --help | grep stub
  --with-http_stub_status_module     enable ngx_http_stub_status_module
[root@web1 nginx-1.12.2]# ./configure --with-http_stub_status_module
[root@web1 nginx-1.12.2]# make && make install
# 修改配置文件,启用stub_status
[root@web1 ~]# vim /usr/local/nginx/conf/nginx.conf
 47         location /status {
 48             stub_status on;
 49         }
# 检查语法,出现syntax is ok表示配置文件正确
[root@web1 ~]# /usr/local/nginx/sbin/nginx -t
# 启动服务
[root@web1 ~]# /usr/local/nginx/sbin/nginx
[root@web1 ~]# ss -tlnp | grep :80
LISTEN     0      128          *:80
# 访问监控页面
[root@web1 ~]# curl http://192.168.4.100/status
Active connections: 1
server accepts handled requests
 1 1 1
Reading: 0 Writing: 1 Waiting: 0
# Active connections:当前客户端与nginx之间的连接数。它等于下面Reading / Writing / Waiting之和
# accepts:自nginx启动之后,客户端访问的总量
# handled:自nginx启动之后,处理过的客户端连接总数。
# requests:自nginx启动之后,处理过的客户端请求总数。
# Reading:正在读取HTTP请求头部的连接总数。
# Writing:正在向客户端发送响应的连接总数。
# Waiting:空闲连接。
# 使用工具向服务器发起多个请求
[root@web1 ~]# yum install -y httpd-tools
# 一共发1000个请求,每次并发数100
[root@web1 ~]# ab -n 1000 -c 100 http://192.168.4.100/status
[root@web1 ~]# curl http://192.168.4.100/status
Active connections: 1
server accepts handled requests
 1040 1040 1004
Reading: 0 Writing: 1 Waiting: 0
编写脚本,用于获取各项数据
[root@web1 ~]# vim /usr/local/bin/nginx_status.sh
#!/bin/bash
case $1 in
active)
curl -s http://192.168.4.100/status | awk '/Active/{print $NF}';;
waiting)
curl -s http://192.168.4.100/status | awk '/Waiting/{print $NF}';;
accepts)
curl -s http://192.168.4.100/status | awk 'NR==3{print $1}';;
esac
[root@web1 ~]# chmod +x /usr/local/bin/nginx_status.sh
[root@web1 ~]# nginx_status.sh active
1
[root@web1 ~]# nginx_status.sh accepts
1047
[root@web1 ~]# nginx_status.sh waiting
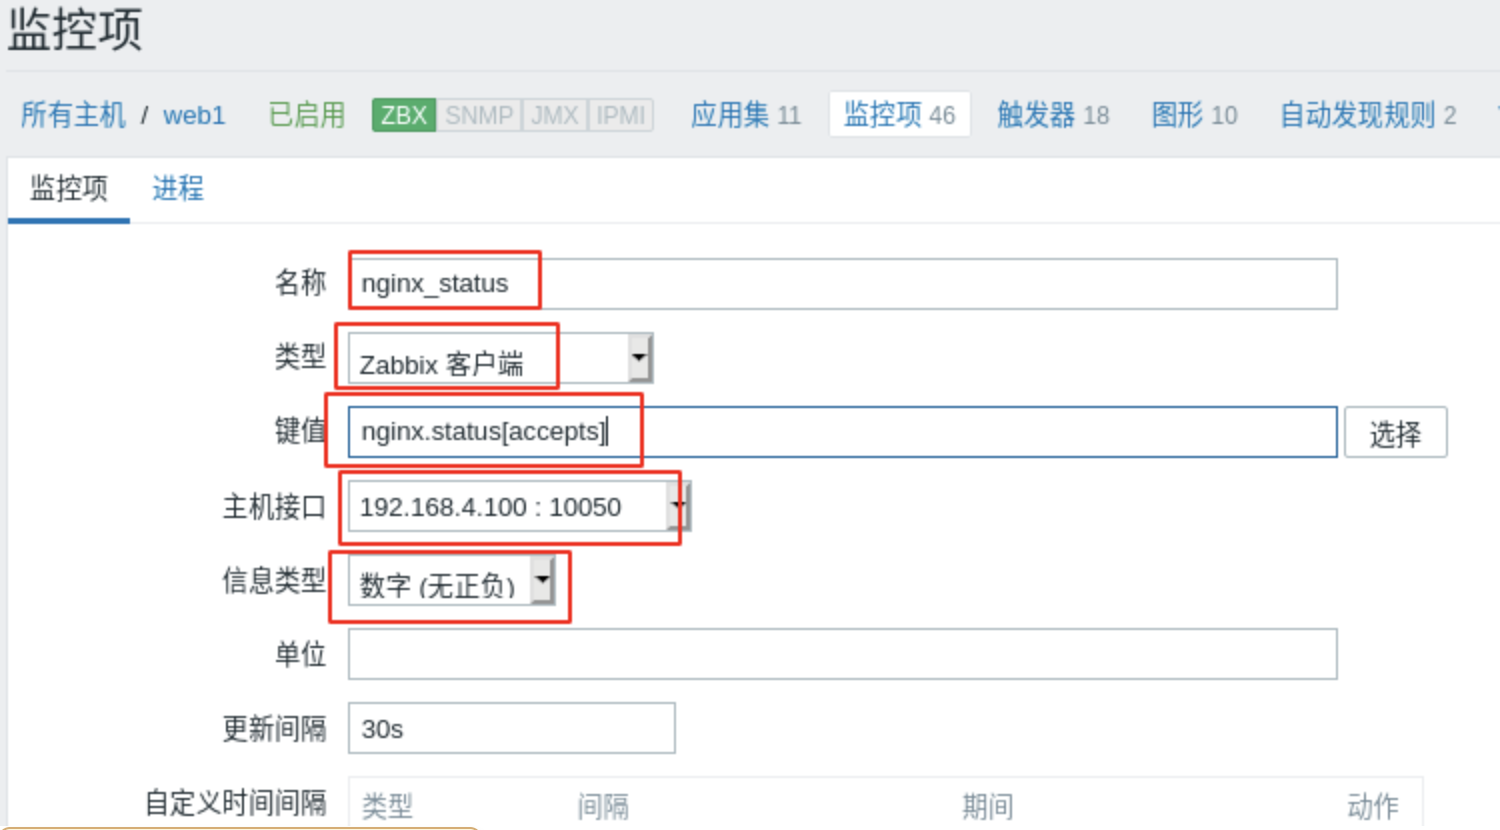
0创建zabbix用到的key,获取各项数据
# key的语法格式
UserParameter=key[*],<command> $1
# key[*]中的*是参数,将会传给后面的位置变量$1
# 创建声明key的文件
[root@web1 ~]# vim /usr/local/etc/zabbix_agentd.conf.d/nginx.status
UserParameter=nginx.status[*],/usr/local/bin/nginx_status.sh $1
# 测试key
[root@web1 ~]# systemctl restart zabbix_agentd.service
[root@web1 ~]# zabbix_get -s 127.0.0.1 -k nginx.status[accepts]
1049
[root@web1 ~]# zabbix_get -s 127.0.0.1 -k nginx.status[active]
1
在zabbix web中添加监控项

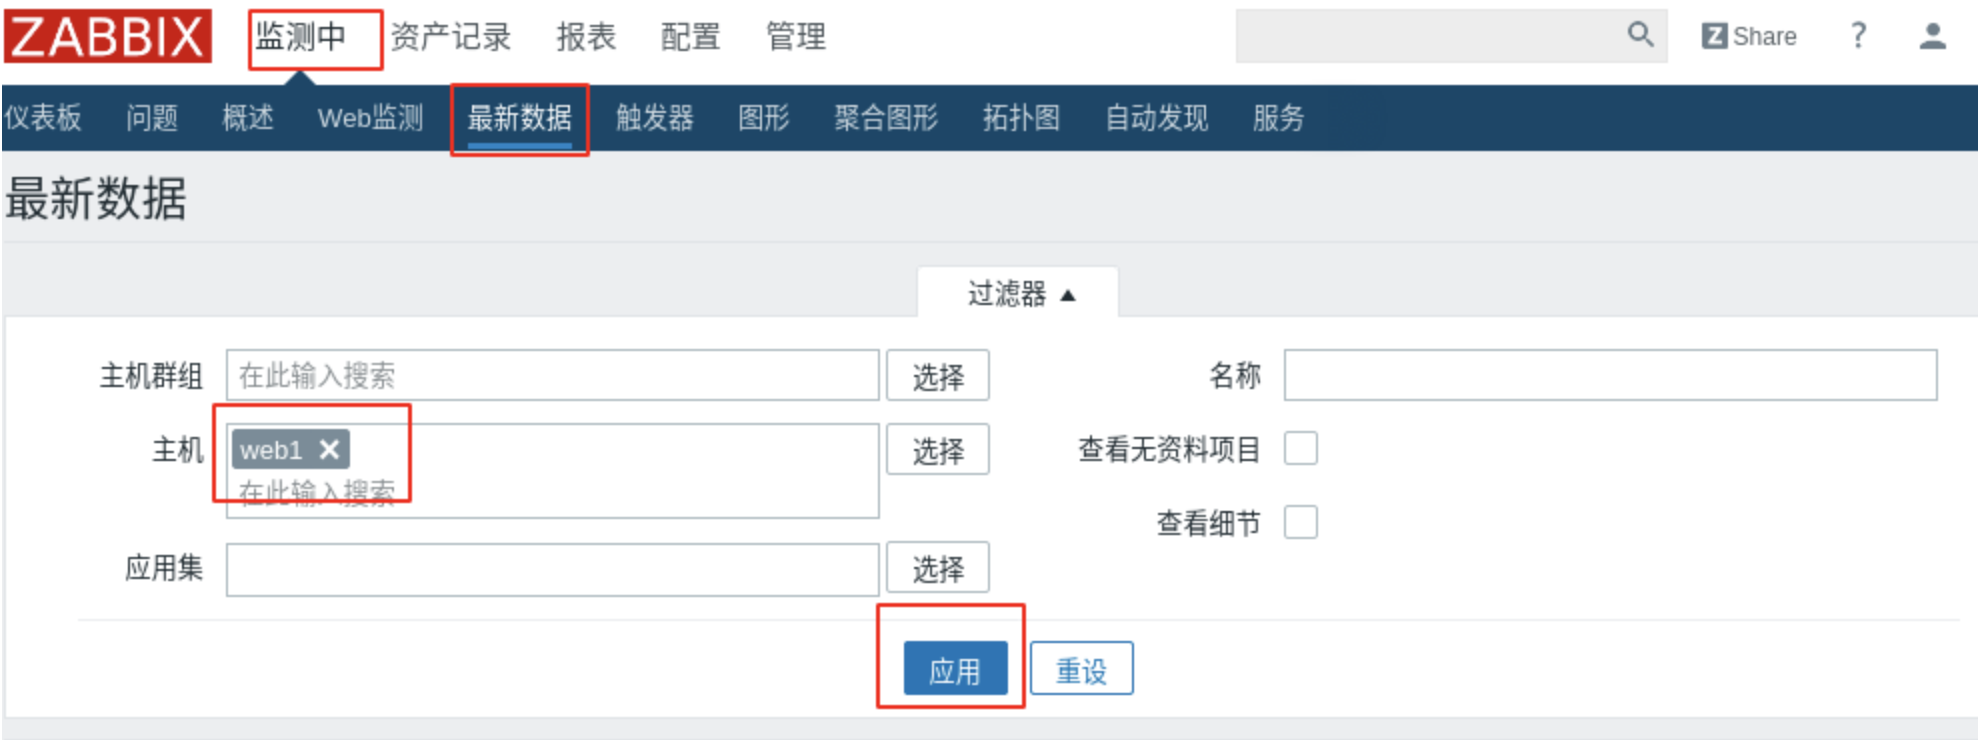
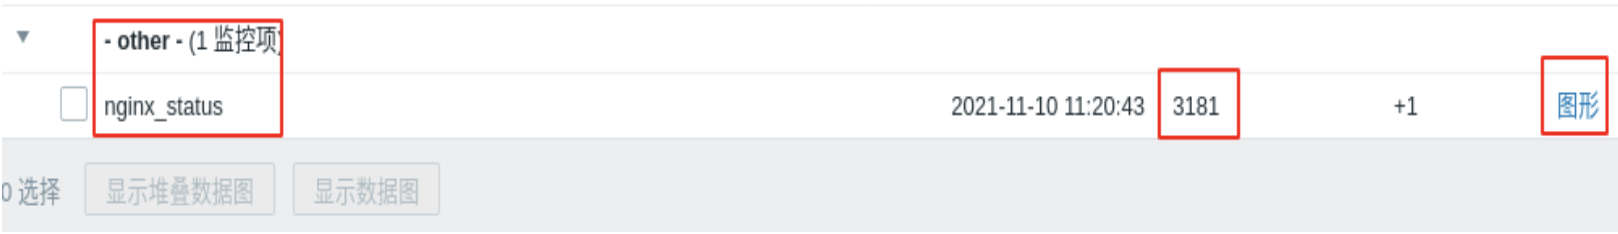
等待一会之后,可以查看最新数据
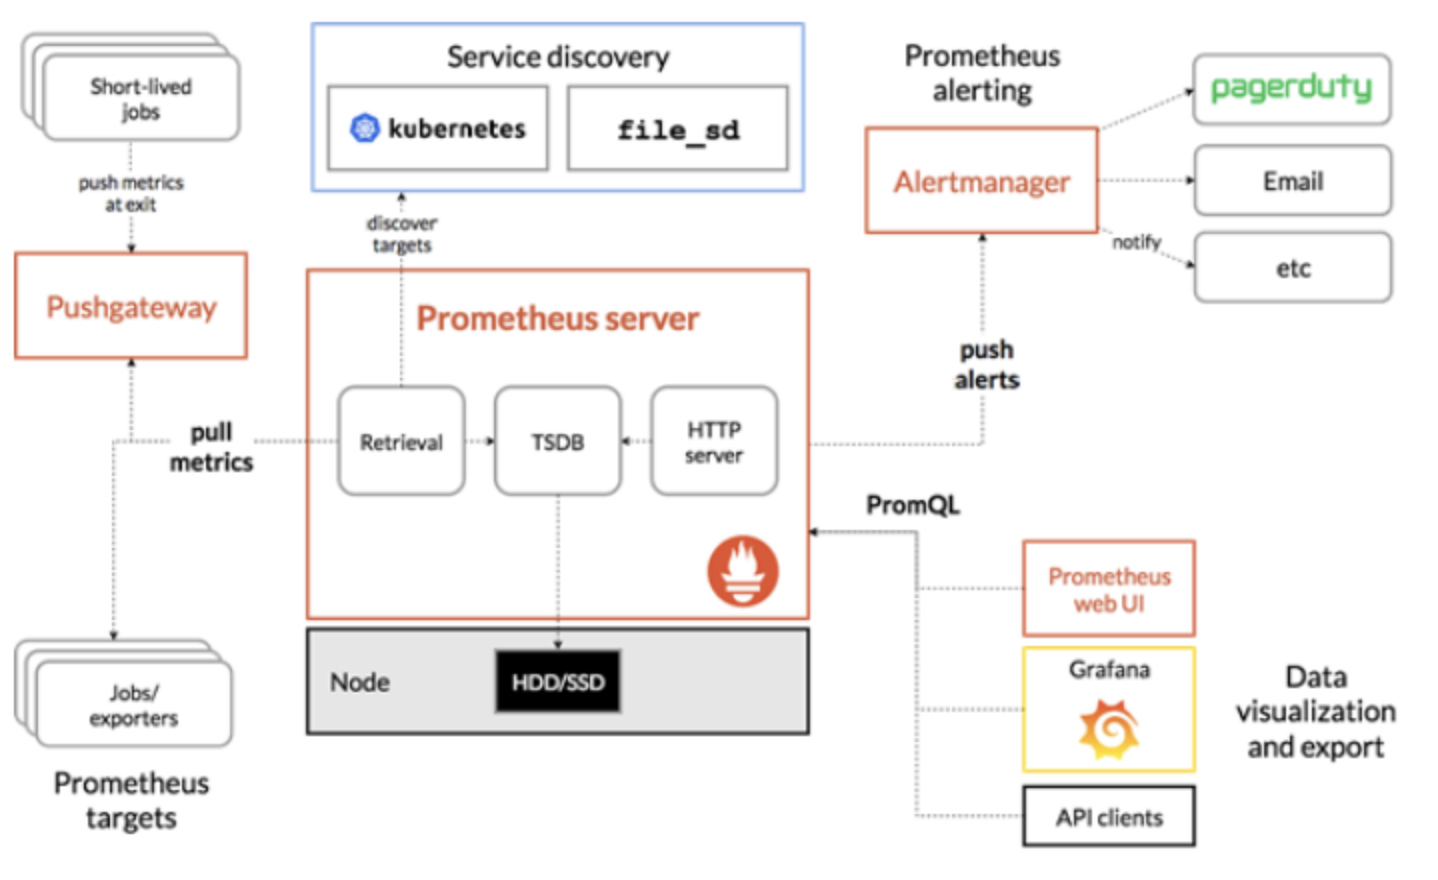
Prometheus
也是一款监控软件,也是一个时序数据库。
主要用在容器监控方面,也可以用于常规的主机监控。
使用google公司开发的go语言编写。
Prometheus是一个框架,可以与其他组件完美结合。
部署Prometheus服务器
prometheus:192.168.4.10
被控端node1:192.168.4.11
[root@zzgrhel8 ~]# scp /linux-soft/2/prometheus_soft.tar.gz 192.168.4.10:/root/
[root@prometheus ~]# tar xf prometheus_soft.tar.gz
[root@prometheus ~]# cd prometheus_soft/
# prometheus是经过编译后的go语言程序,相当于绿色软件,解压即用
[root@prometheus prometheus_soft]# tar xf prometheus-2.17.2.linux-386.tar.gz
[root@prometheus prometheus_soft]# mv prometheus-2.17.2.linux-386 /usr/local/prometheus
# 修改配置文件
[root@prometheus ~]# vim /usr/local/prometheus/prometheus.yml
 29     - targets: ['192.168.4.10:9090']
# 注意:prometheus主机的时间需要与真机时间一致,如果不一致,修改时间
[root@prometheus ~]# date -s "20220105 14:18:00"
# 检查语法
[root@prometheus ~]# /usr/local/prometheus/promtool check config /usr/local/prometheus/prometheus.yml
Checking /usr/local/prometheus/prometheus.yml
  SUCCESS: 0 rule files found
# 创建服务文件
[root@prometheus ~]# vim /usr/lib/systemd/system/prometheus.service
[Unit]
Description=Prometheus Monitoring System
After=network.target
[Service]
ExecStart=/usr/local/prometheus/prometheus \
  --config.file=/usr/local/prometheus/prometheus.yml \
  --storage.tsdb.path=/usr/local/prometheus/data/
[Install]
WantedBy=multi-user.target
# 启服务
[root@prometheus ~]# systemctl daemon-reload
[root@prometheus ~]# systemctl enable prometheus.service --now
[root@prometheus ~]# ss -tlnp | grep :9090
LISTEN     0      128         :::9090
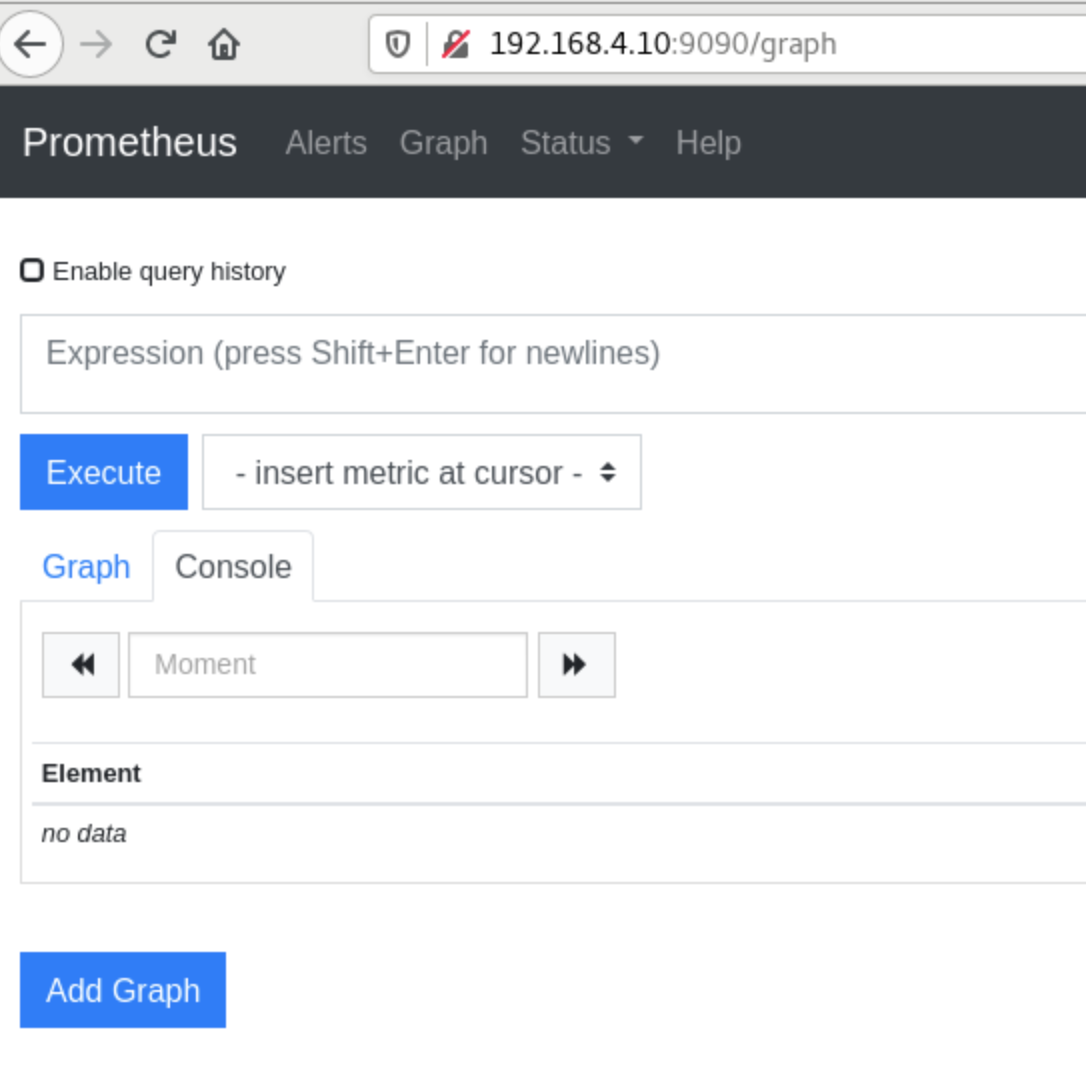
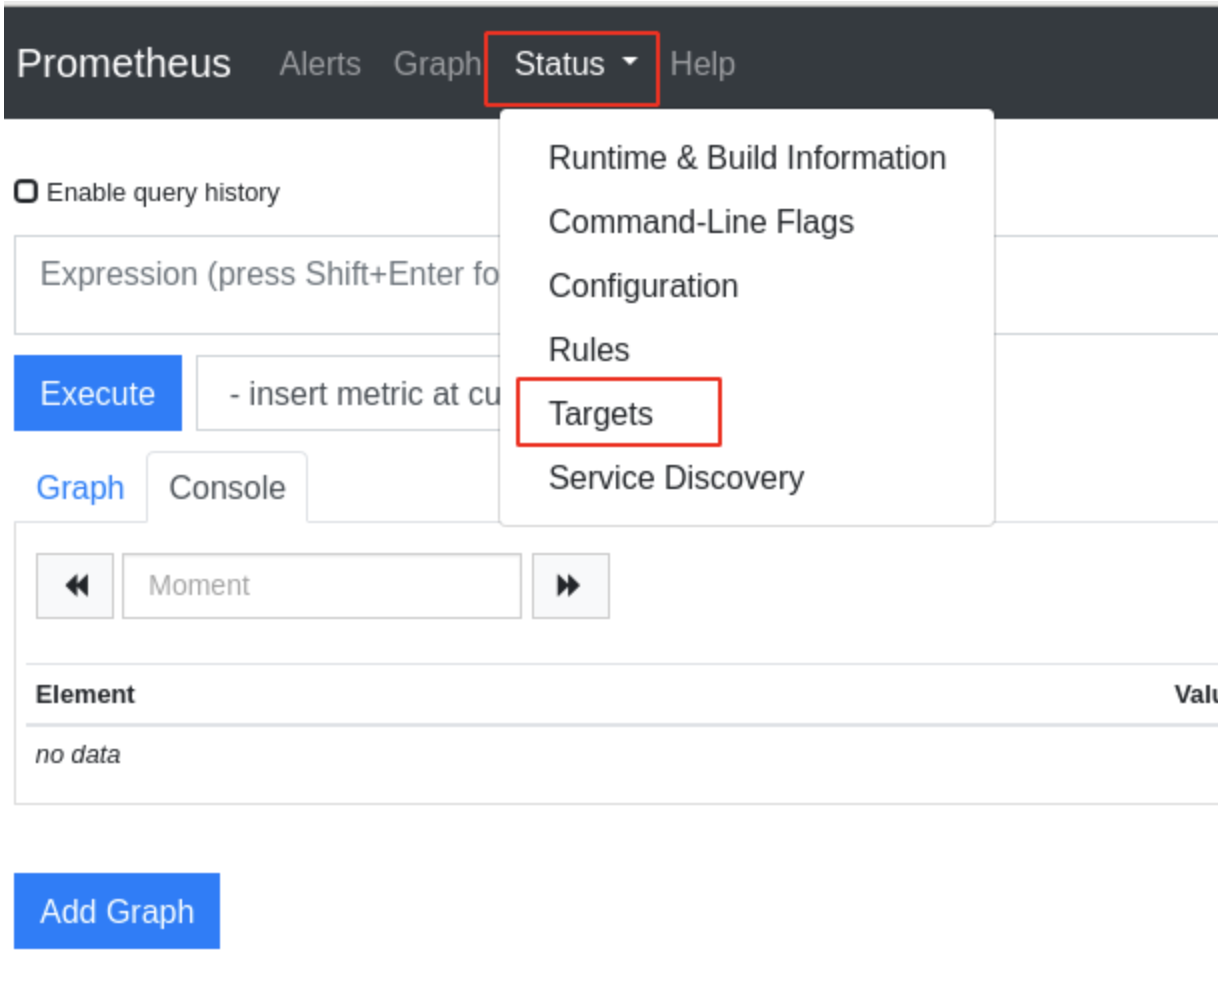
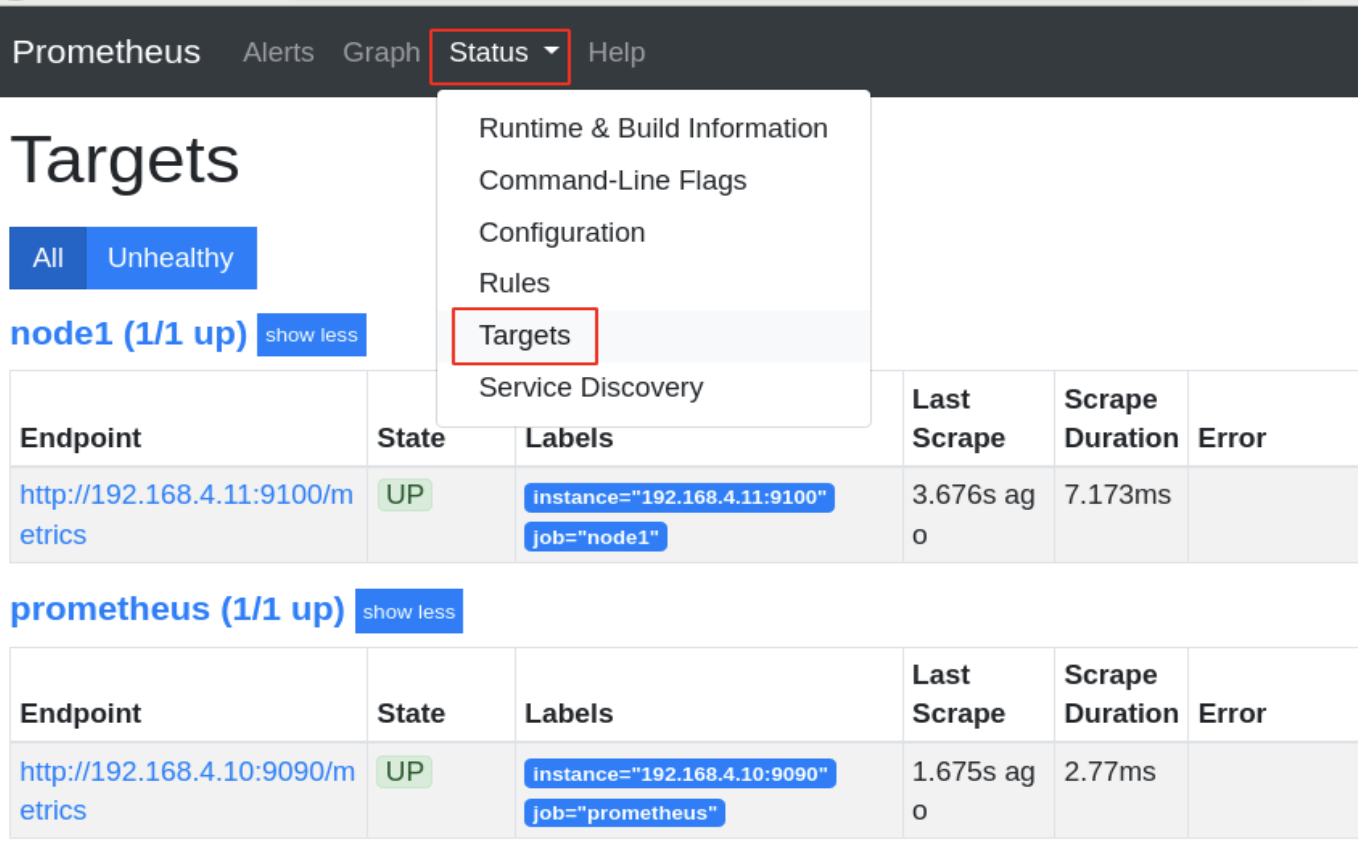
查看监控页面
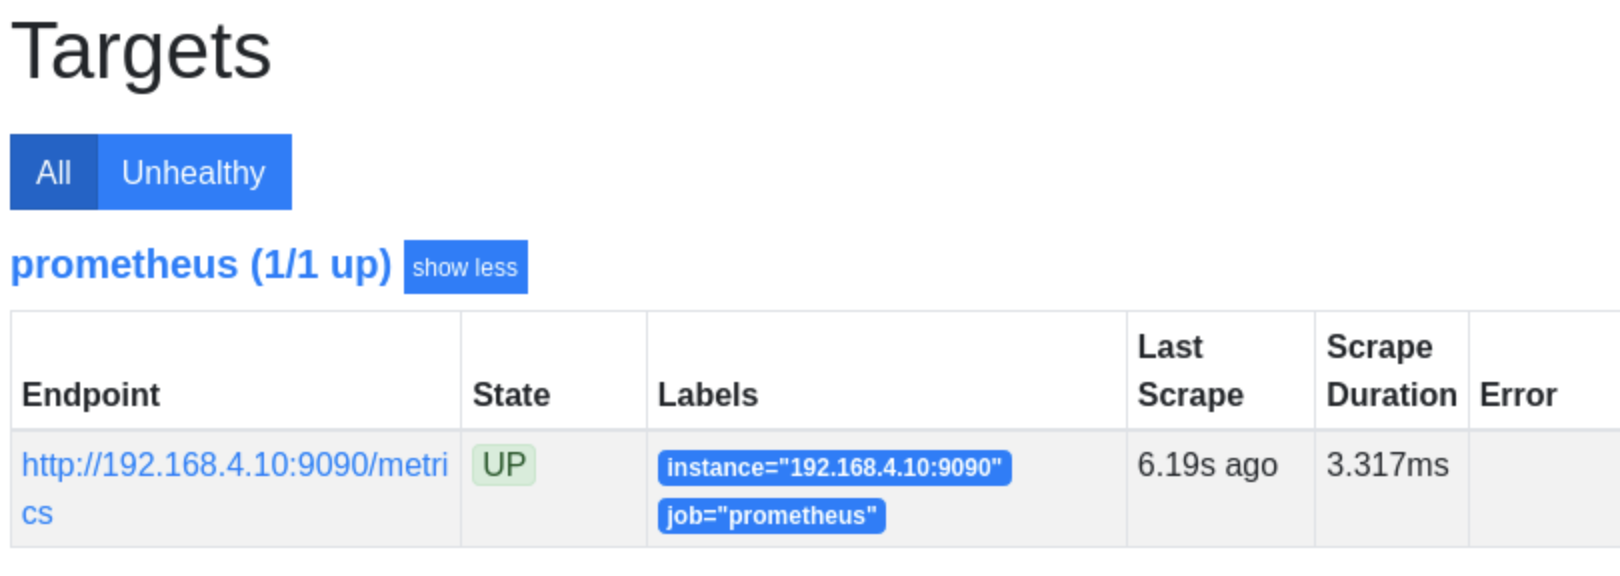
被监控的对象称为targets
prometheus已经在监控自己了
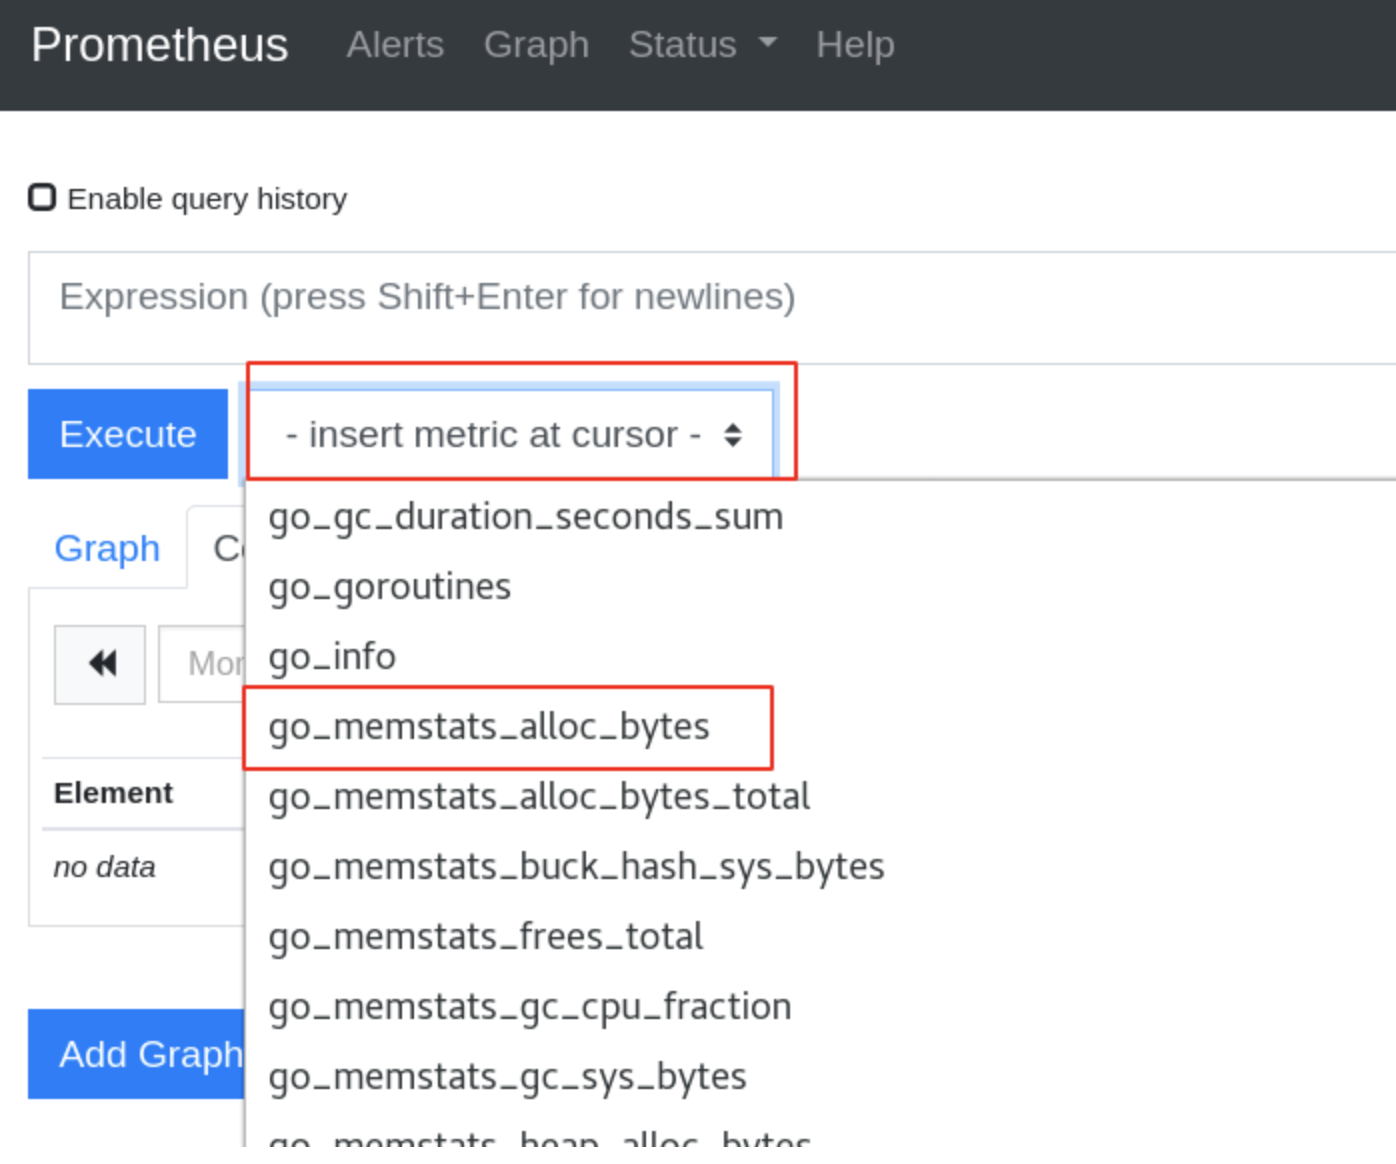
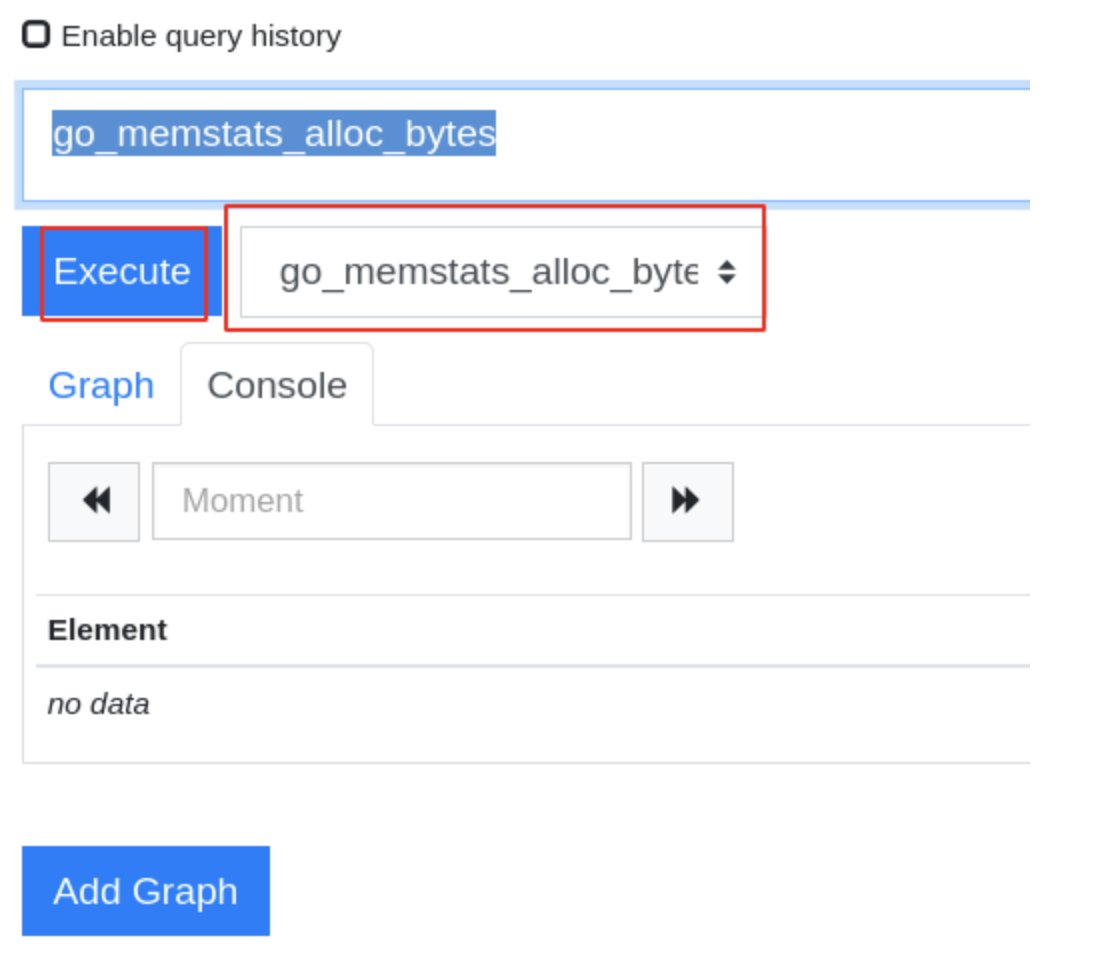
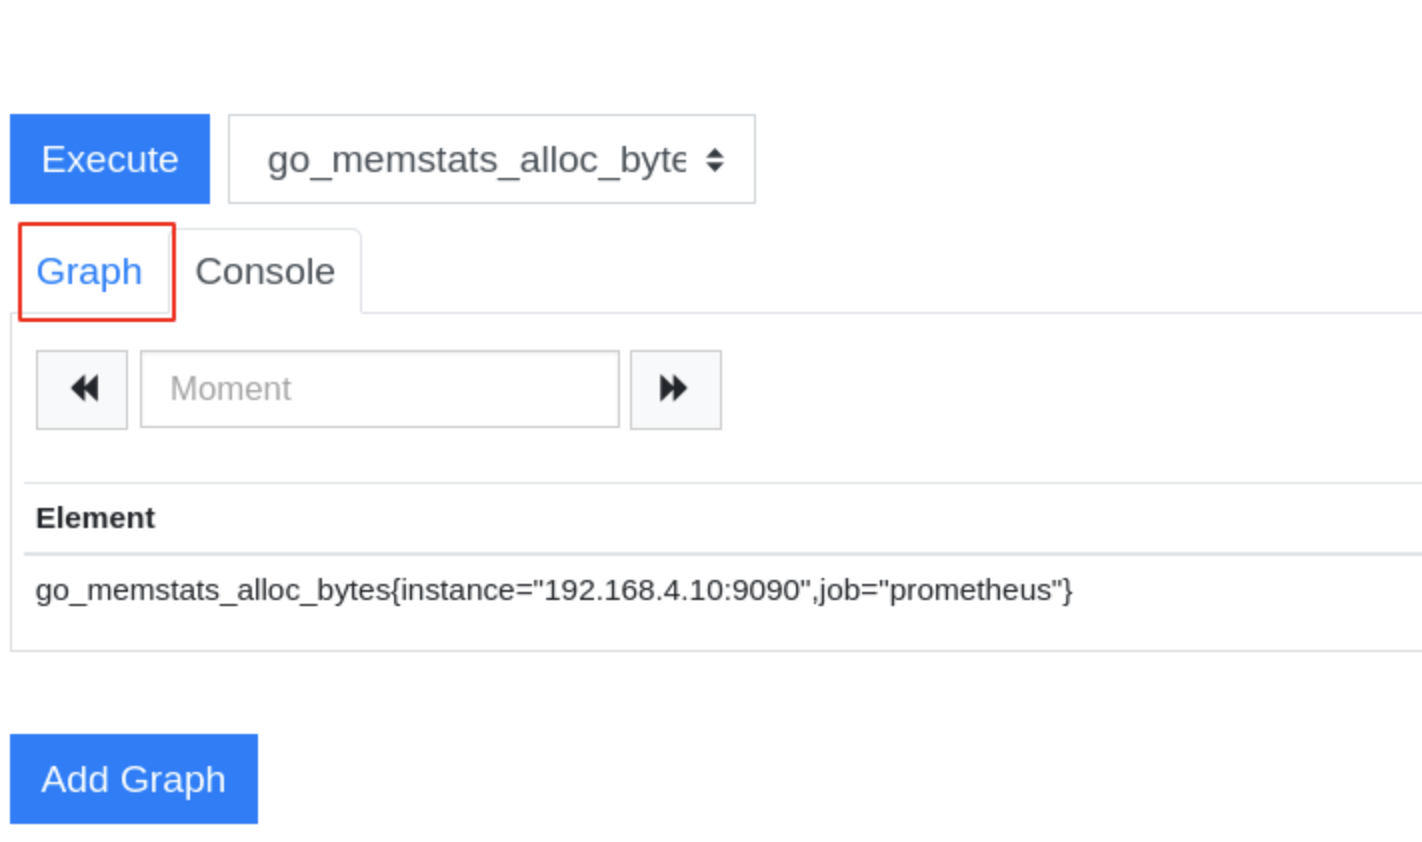
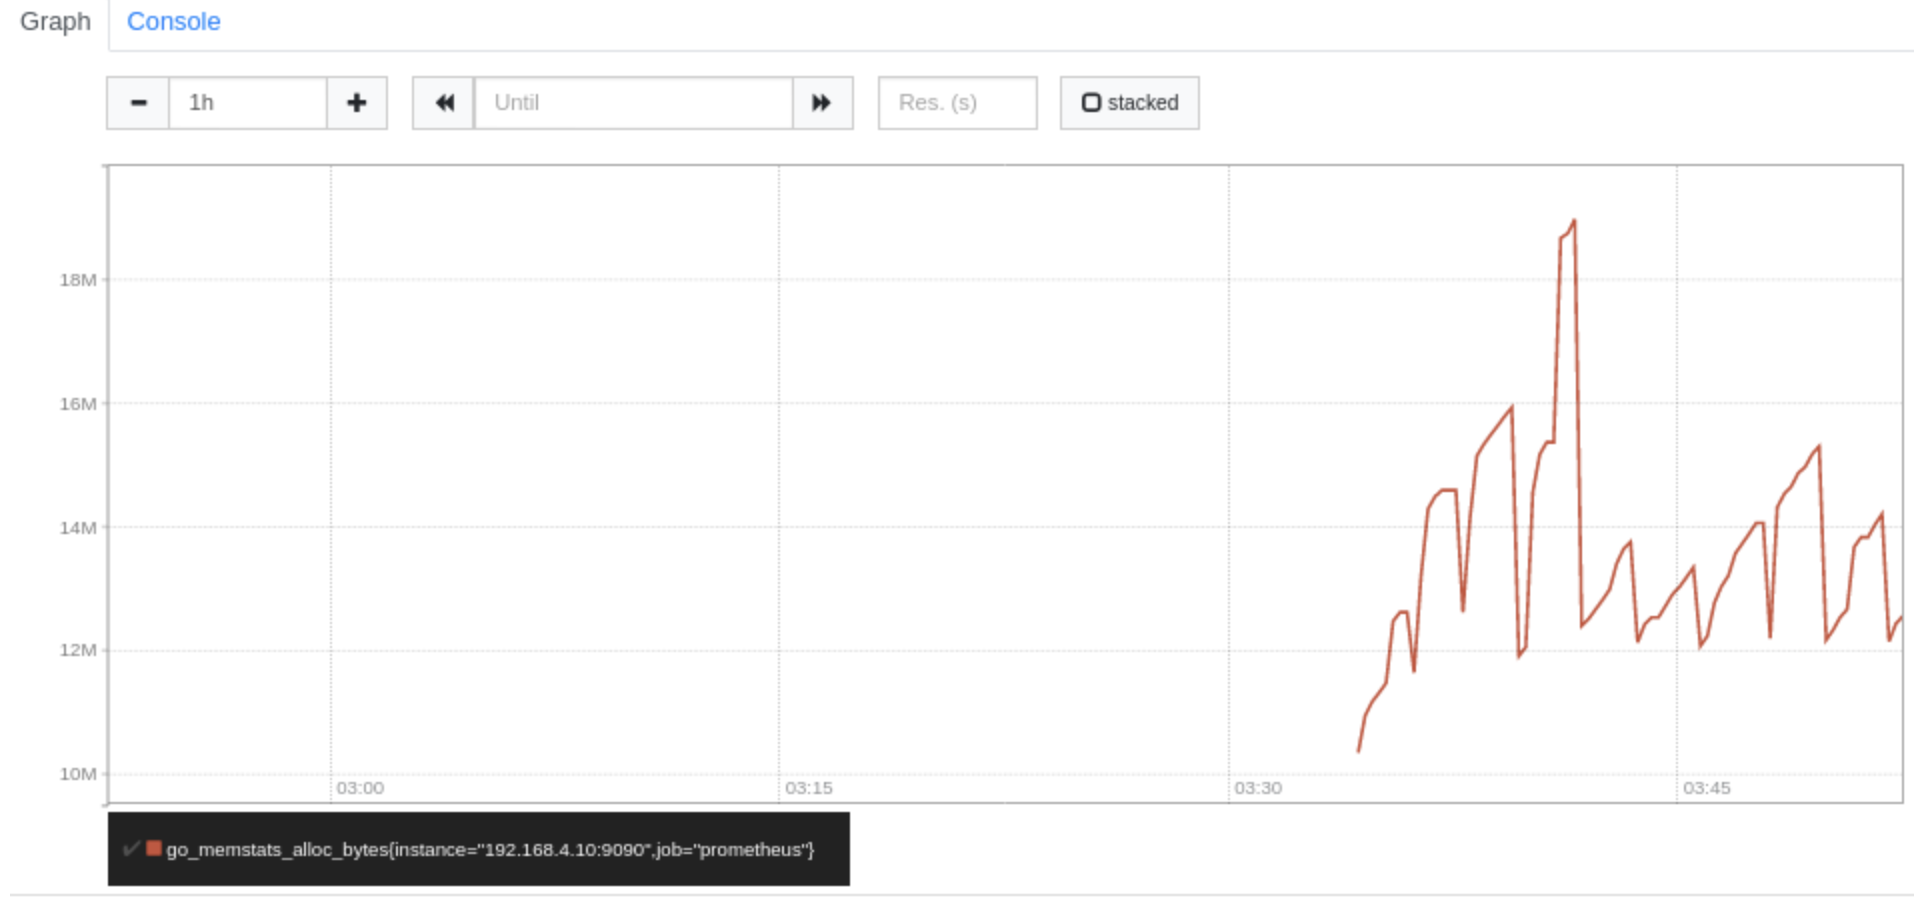
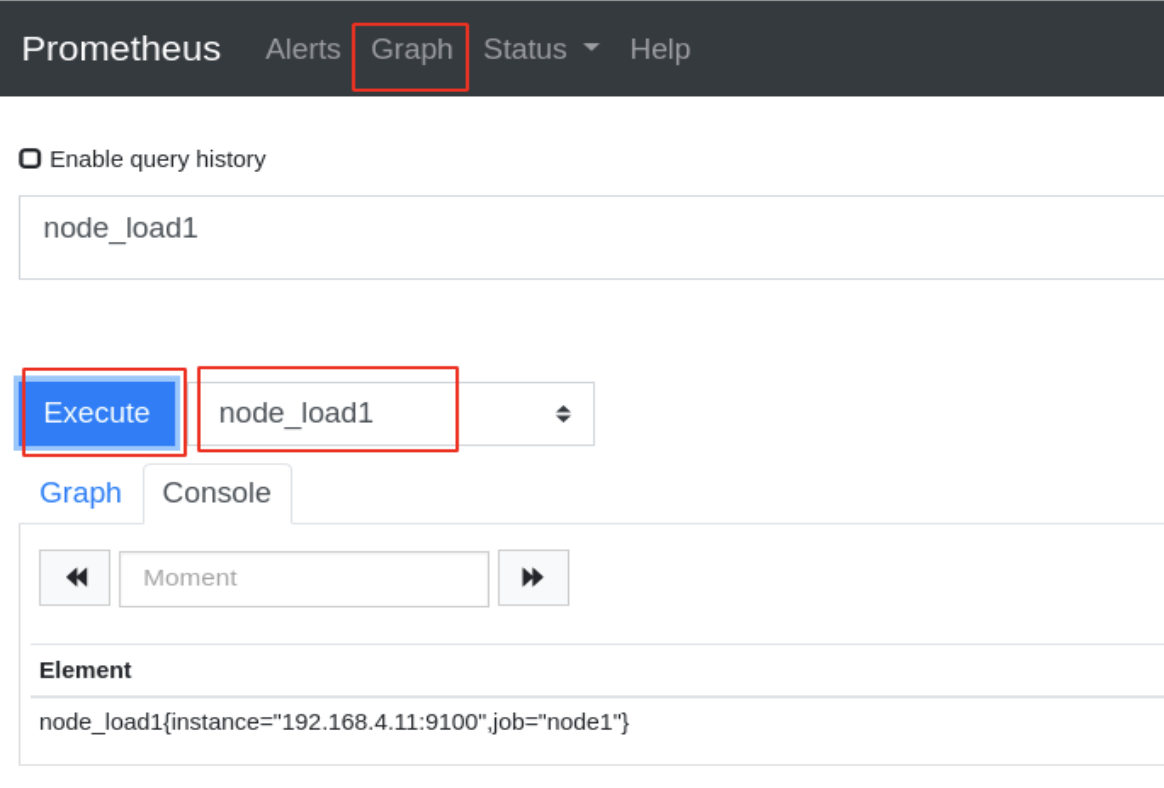
查看监控图像:

添加需要查看的监控项:
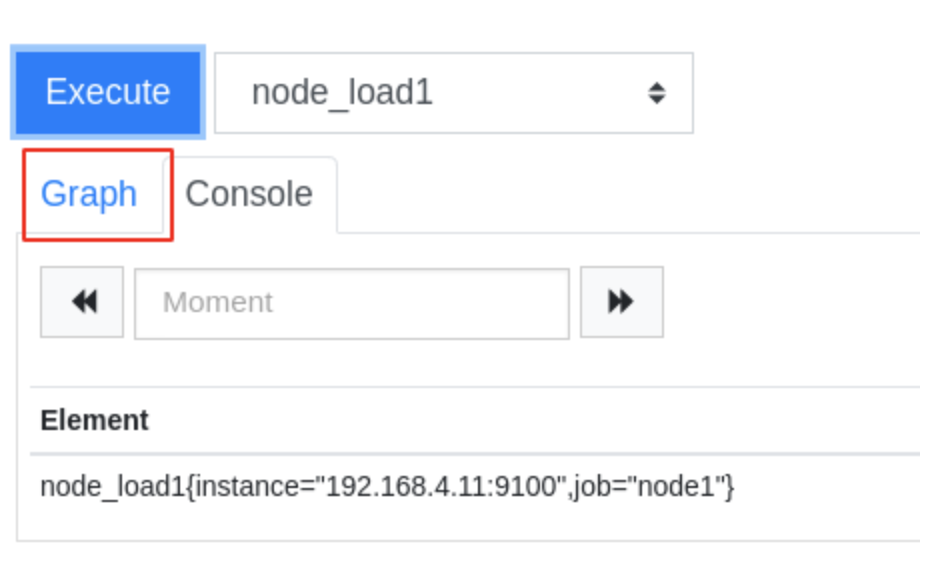
查看监控项的图形信息:
添加被监控端
监控方式:
拉取:pull。监控端联系被监控端,采集数据
推送:push。被监控端主动把数据发给监控端。在prometheus中,push的方式需要额外的组件pushgateway
被监控端根据自身运行的服务,可以运行不同的exporter(被监控端安装的、可以与Prometheus通信,实现数据传递的软件)
exporter列表:https://prometheus.io/docs/instrumenting/exporters/
部署通用的监控exporter
node-exporter用于监控硬件和系统的常用指标
exporter运行于被监控端,以服务的形式存在。每个exporter所使用的端口号都不一样。
在node1[192.168.4.11]上部署node exporter
# 部署
[root@prometheus prometheus_soft]# scp node_exporter-1.0.0-rc.0.linux-amd64.tar.gz 192.168.4.11:/root/
[root@node1 ~]# tar xf node_exporter-1.0.0-rc.0.linux-amd64.tar.gz
[root@node1 ~]# mv node_exporter-1.0.0-rc.0.linux-amd64 /usr/local/node_exporter
[root@node1 ~]# vim /usr/lib/systemd/system/node_exporter.service
[Unit]
Description=node_exporter
After=network.target
[Service]
Type=simple
ExecStart=/usr/local/node_exporter/node_exporter
[Install]
WantedBy=multi-user.target
[root@node1 ~]# systemctl daemon-reload
[root@node1 ~]# systemctl enable node_exporter.service --now
[root@node1 ~]# ss -tlnp | grep :9100
LISTEN     0      128         :::9100
在Prometheus服务器上添加监控节点
# 在配置文件中追加以下内容。特别注意缩进
[root@prometheus ~]# vim /usr/local/prometheus/prometheus.yml
  - job_name: 'node1'
    static_configs:
    - targets: ['192.168.4.11:9100']
[root@prometheus ~]# systemctl restart prometheus.service
查看结果:
查看node1节点的1分钟平均负载
grafana可视化
grafana是一款开源的、跨平台的、基于web的可视化工具
展示方式:客户端图表、面板插件
数据源可以来自于各种源,如prometheus
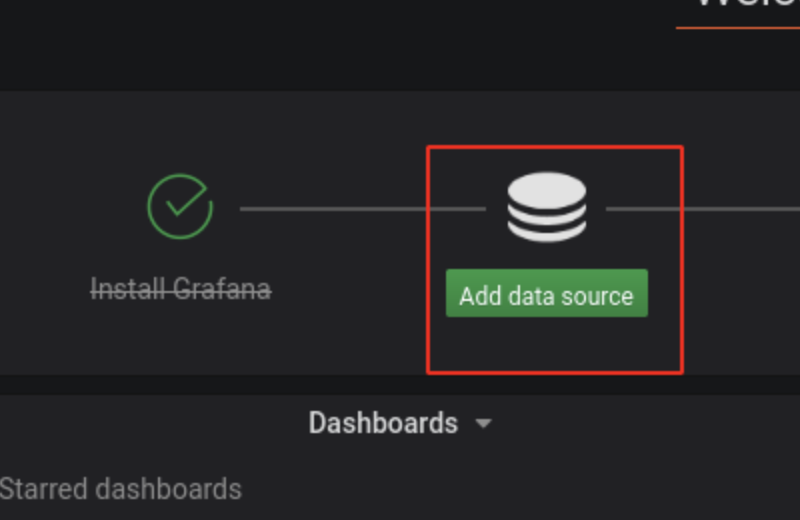
部署grafana
装包、启服务
[root@prometheus ~]# cd prometheus_soft/
[root@prometheus prometheus_soft]# ls *rpm
grafana-6.7.3-1.x86_64.rpm
[root@prometheus prometheus_soft]# yum install -y grafana-6.7.3-1.x86_64.rpm
[root@prometheus ~]# systemctl enable grafana-server.service --now
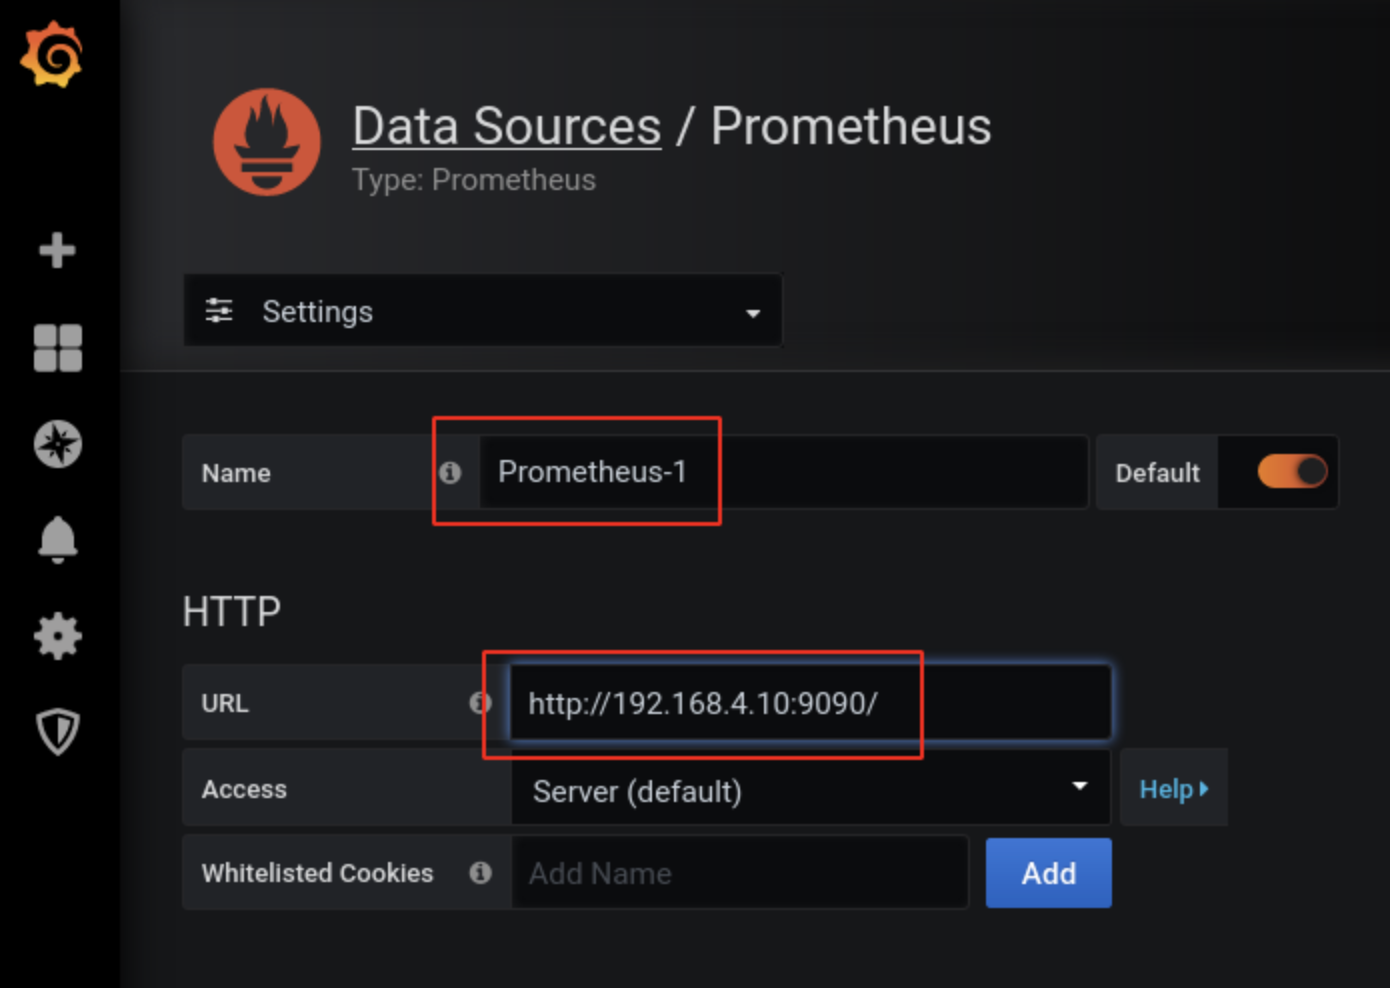
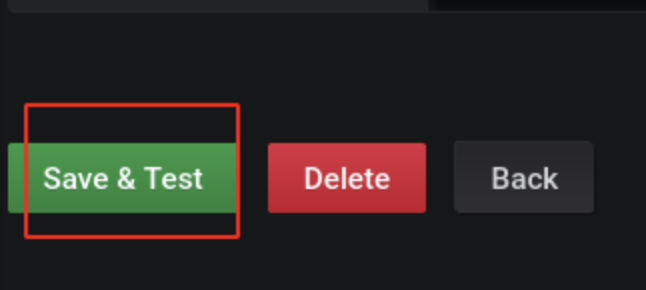
修改配置,对接prometheus
访问http://192.168.4.10:3000。初始用户名和密码都是admin。第一次登陆时,要求改密码,我的密码改为tedu.cn。


对接数据的步骤:
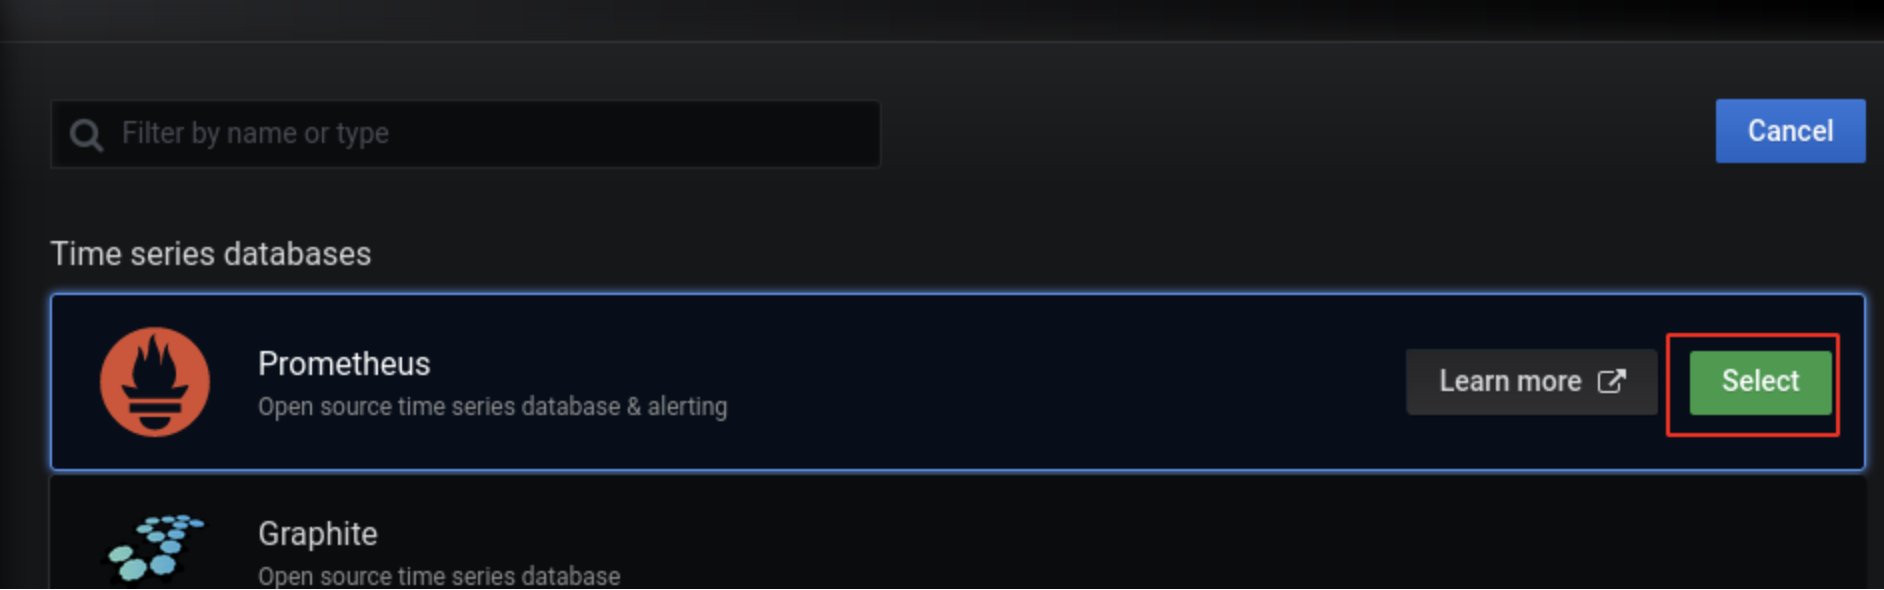
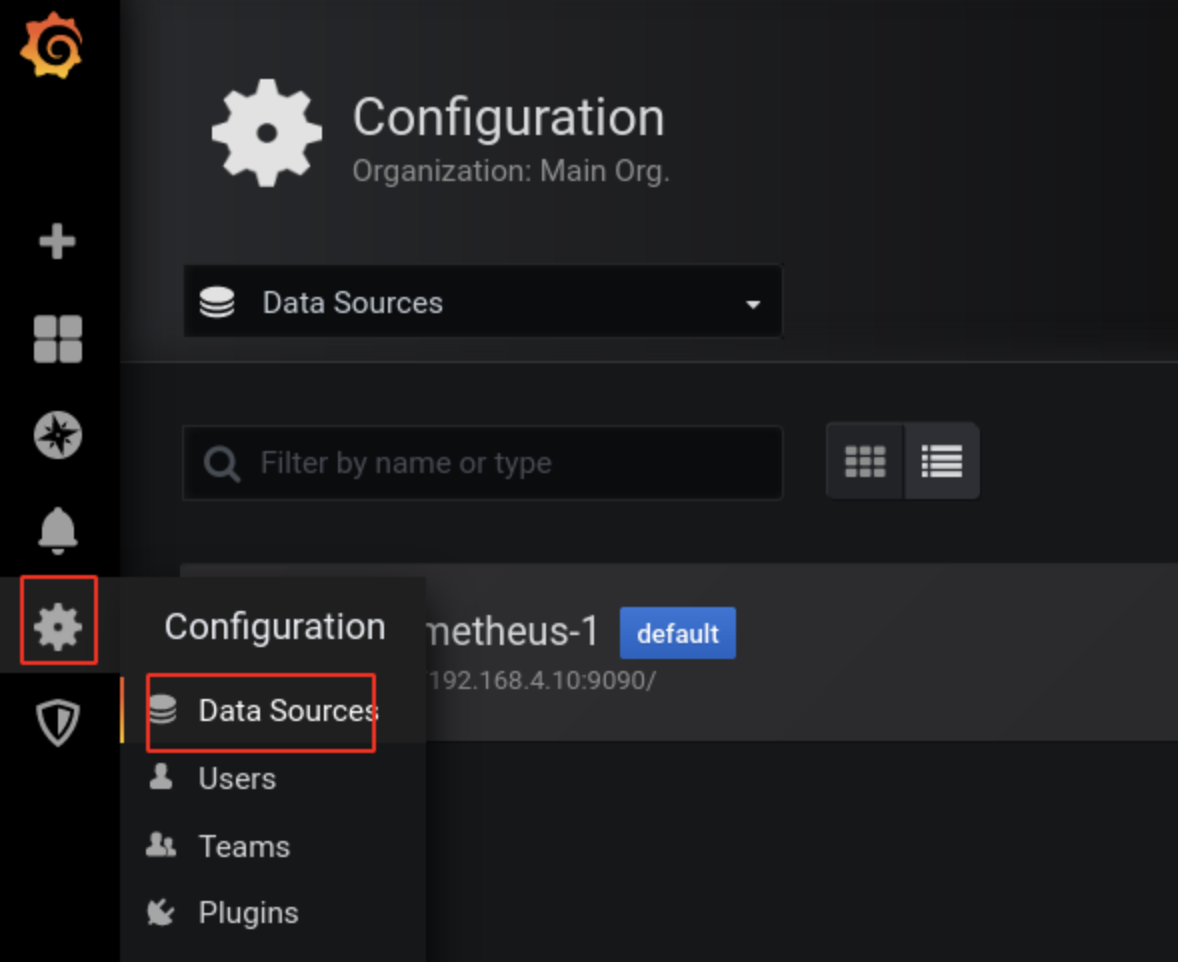
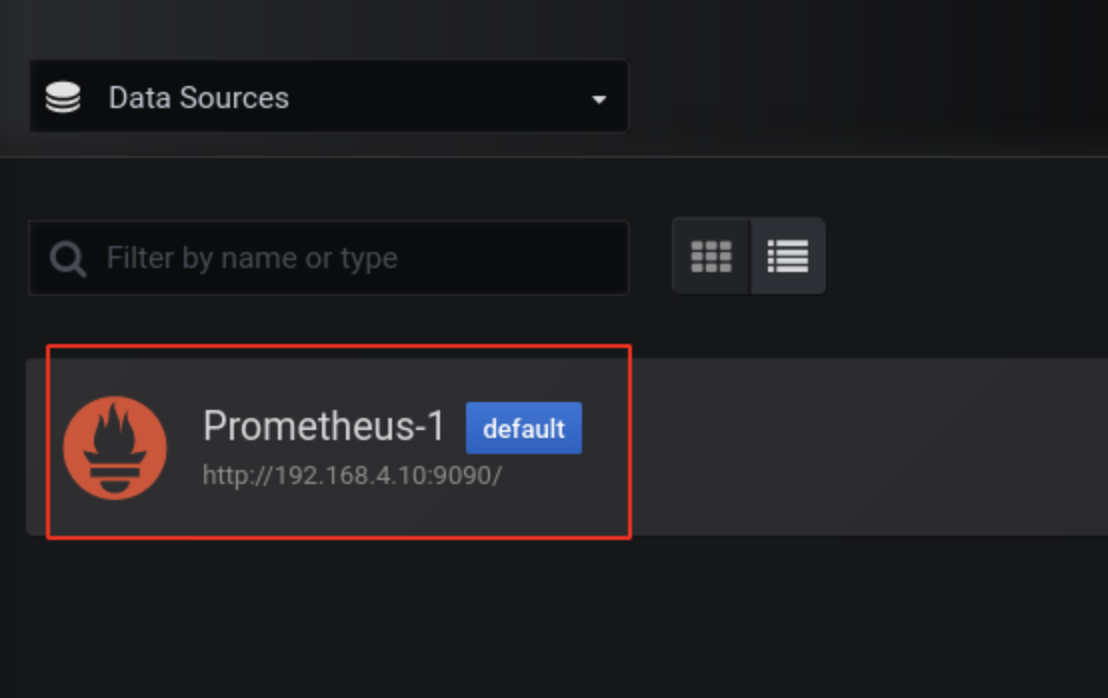
添加数据源
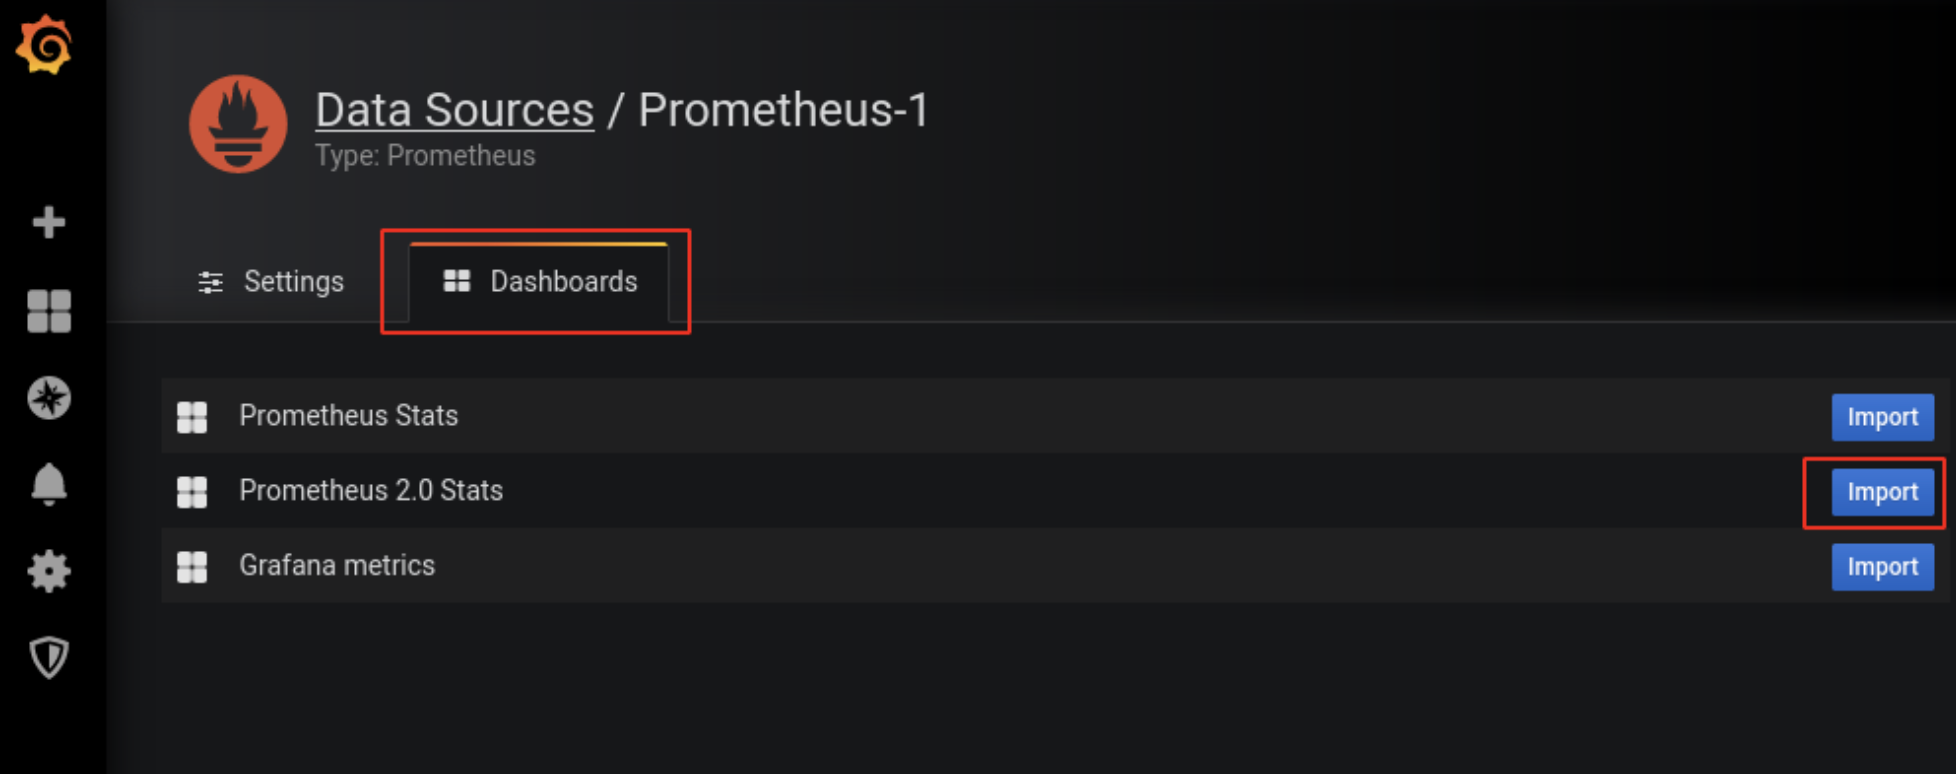
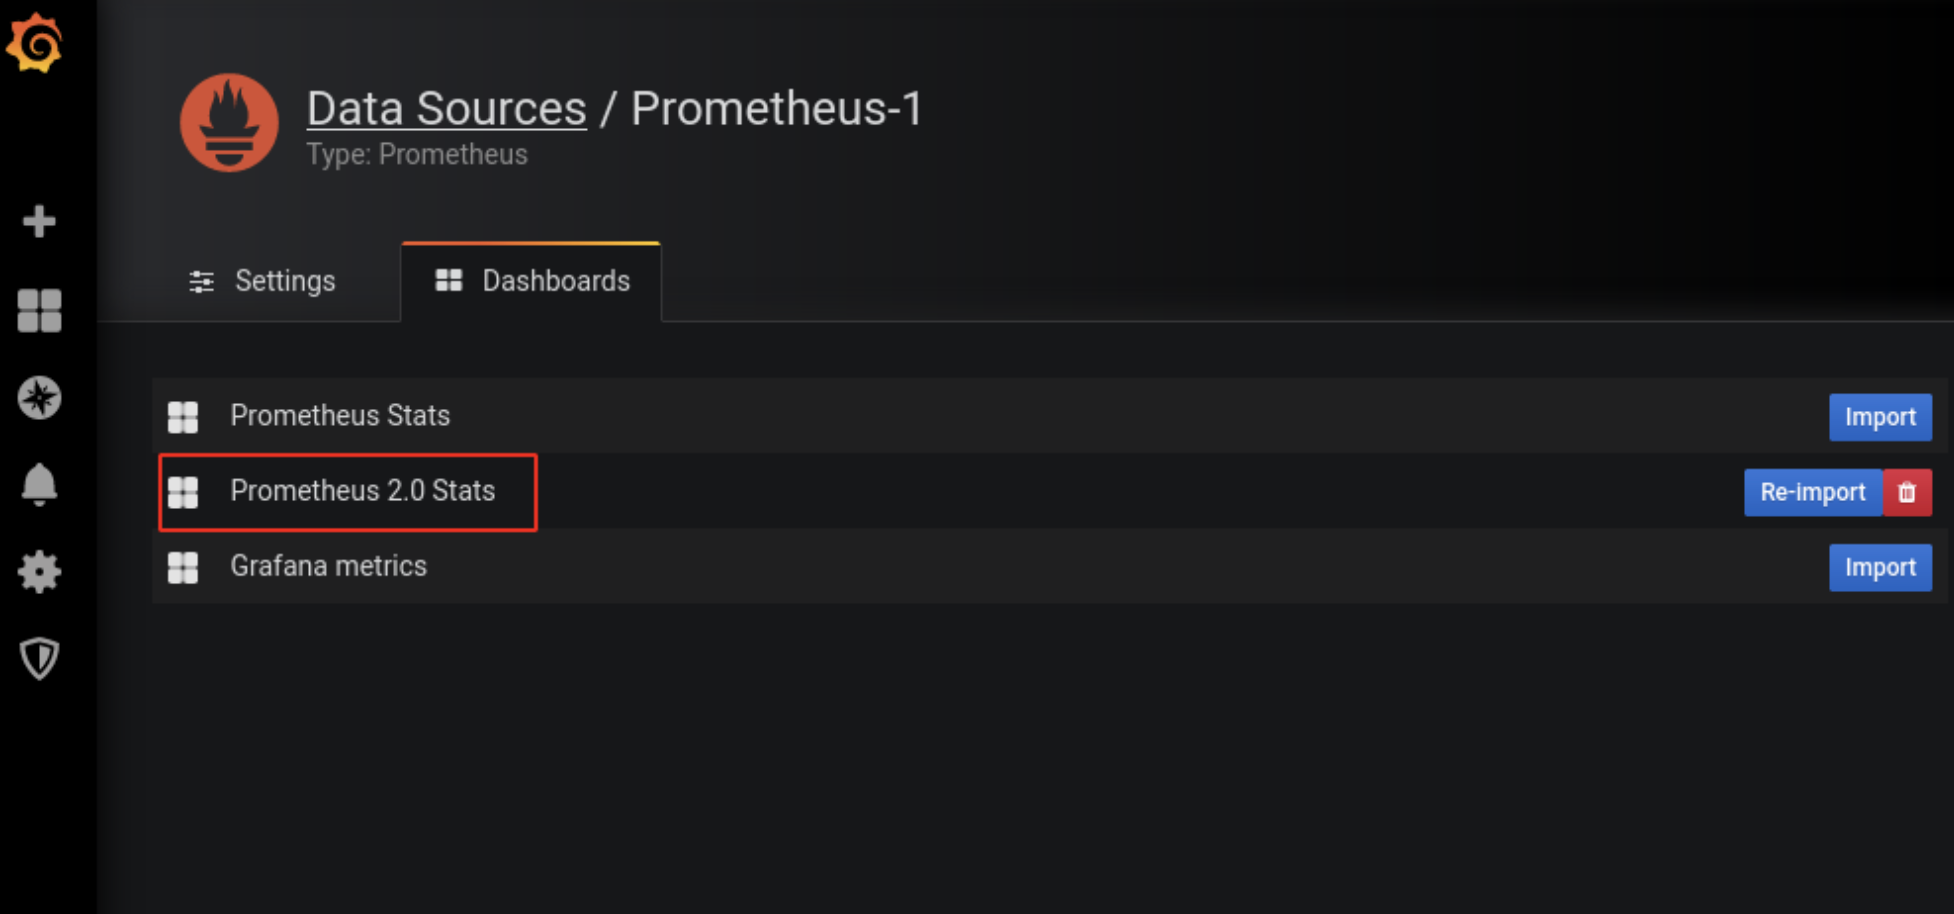
为数据展示选择展示方式(dashboard仪表盘)
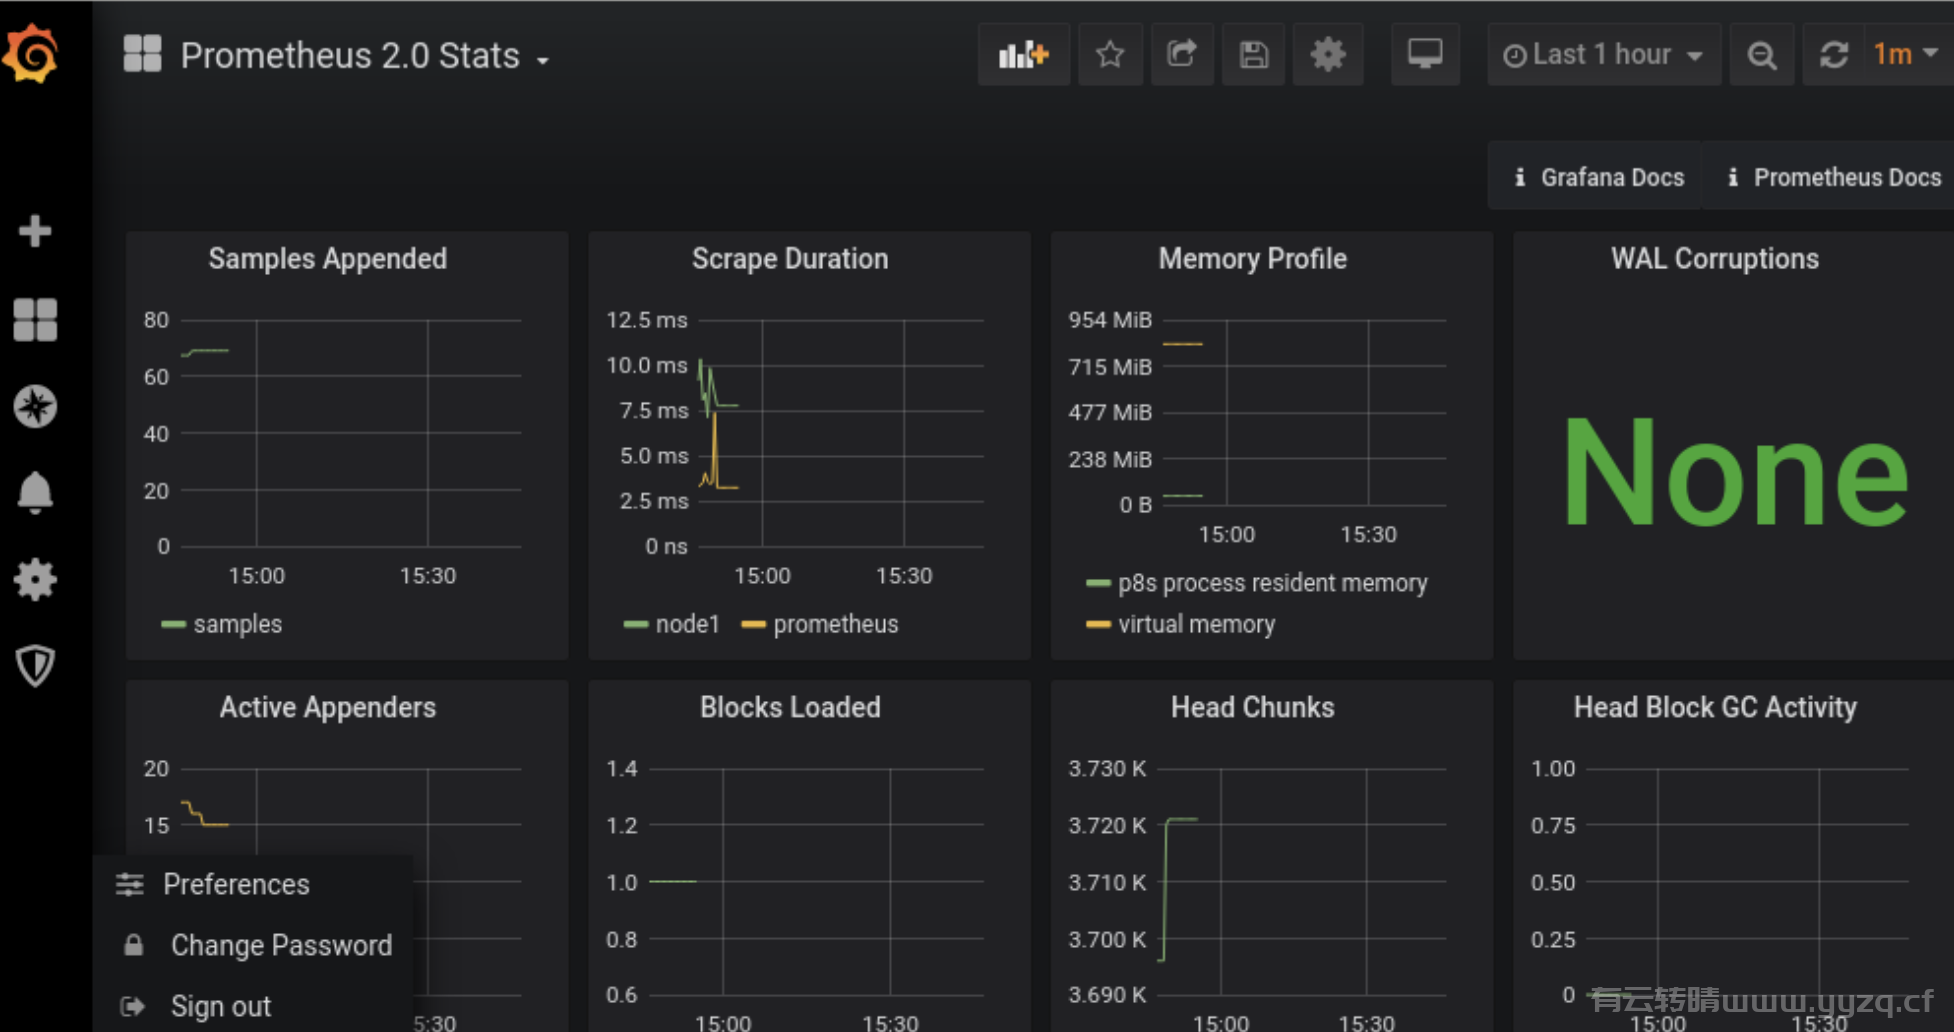
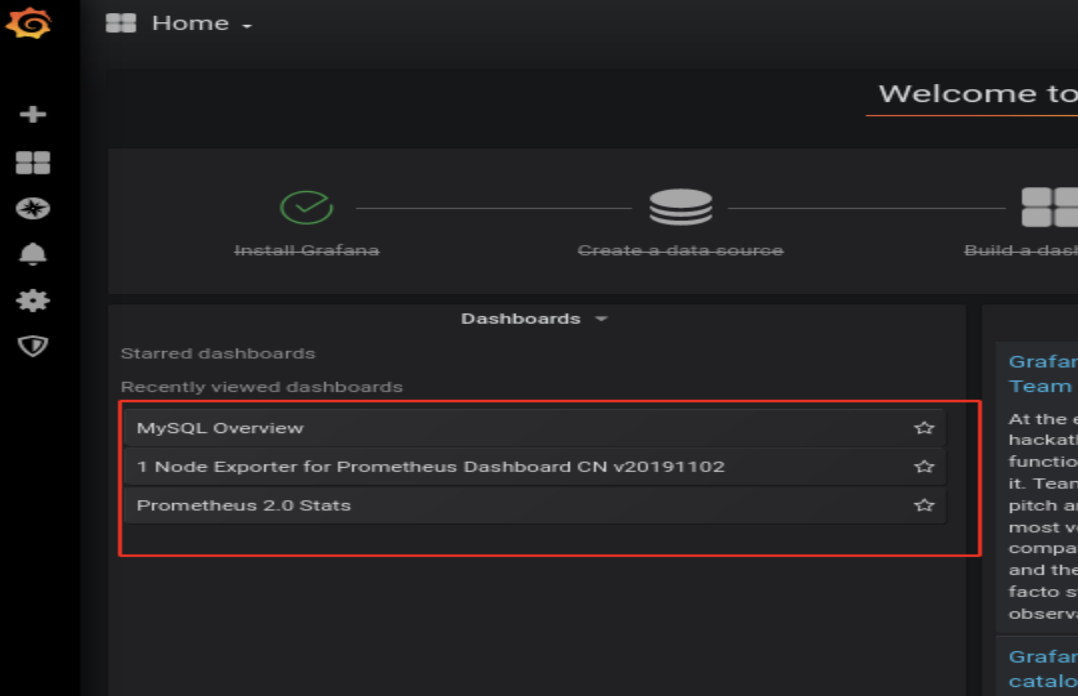
查看结果
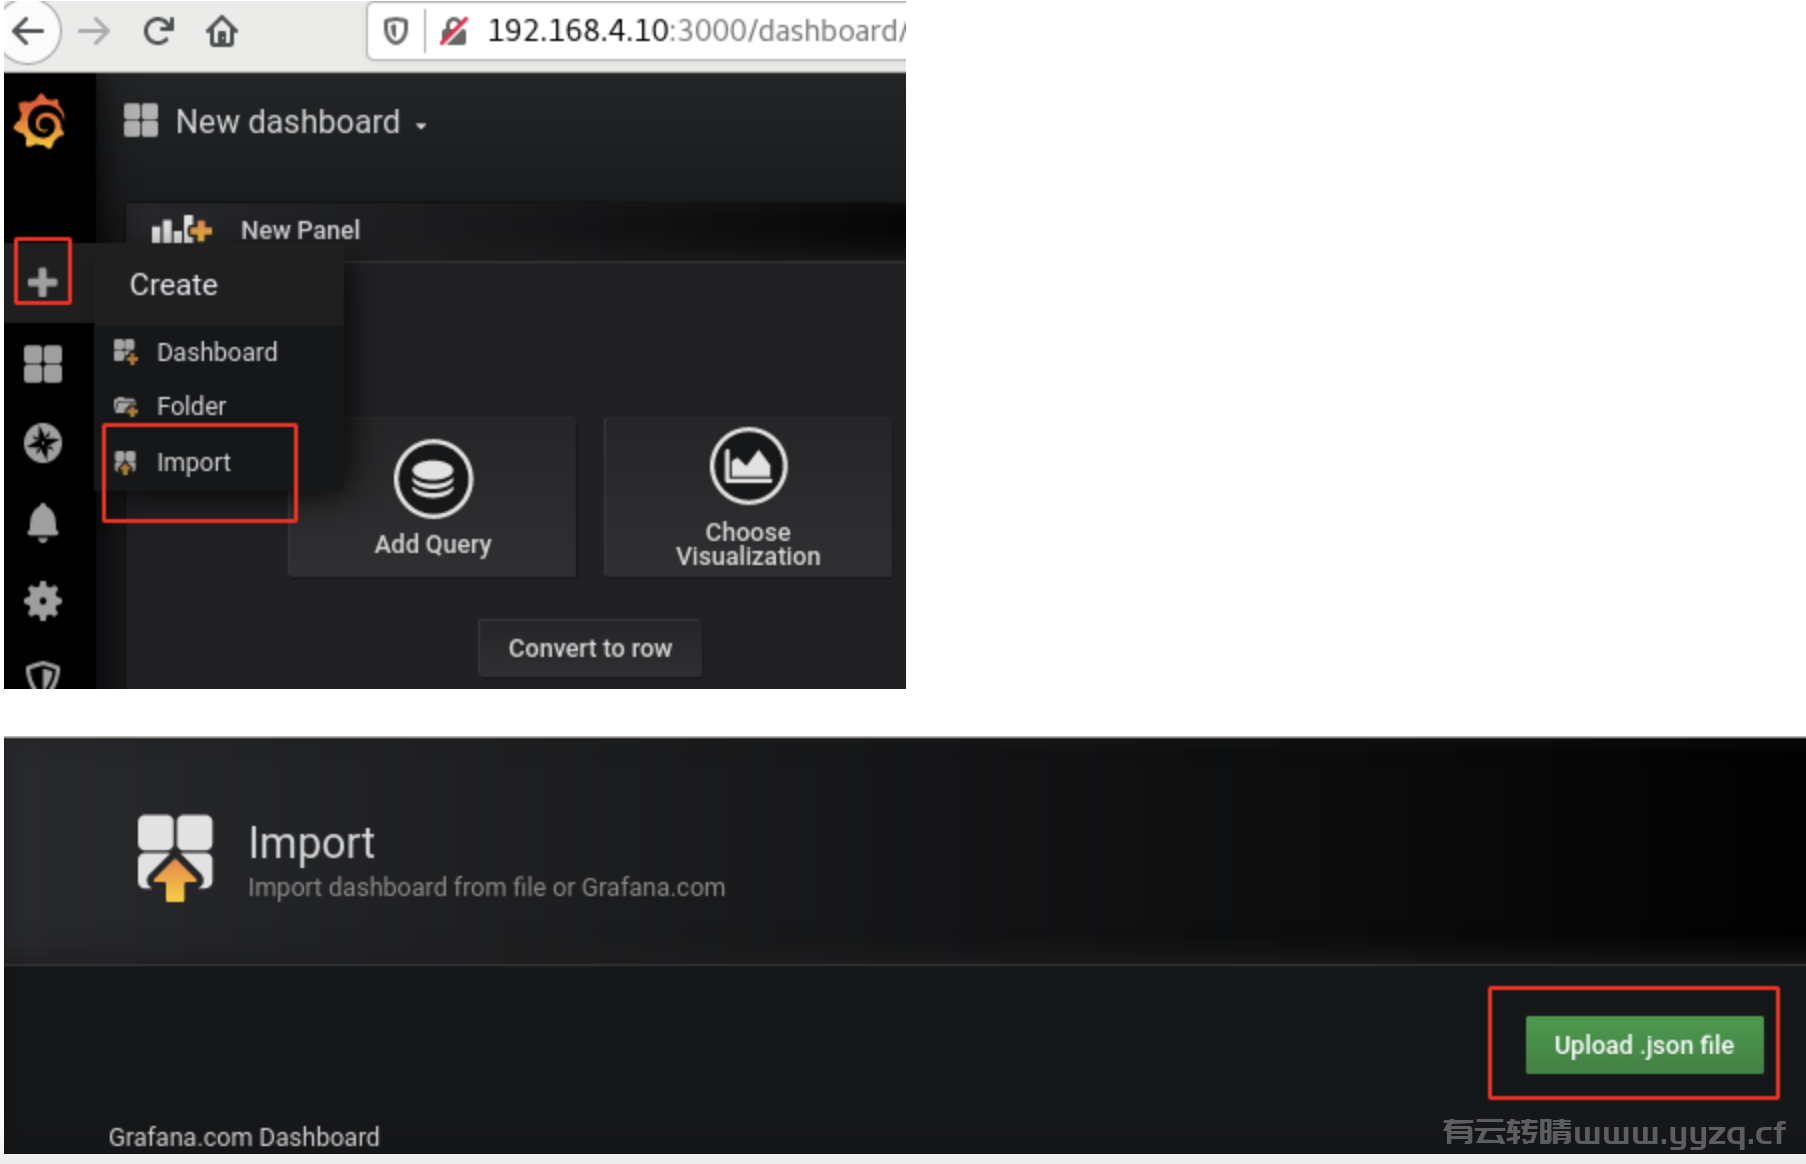
选择展示方式。导入模板文件,展示不同主题风格。
查看结果:
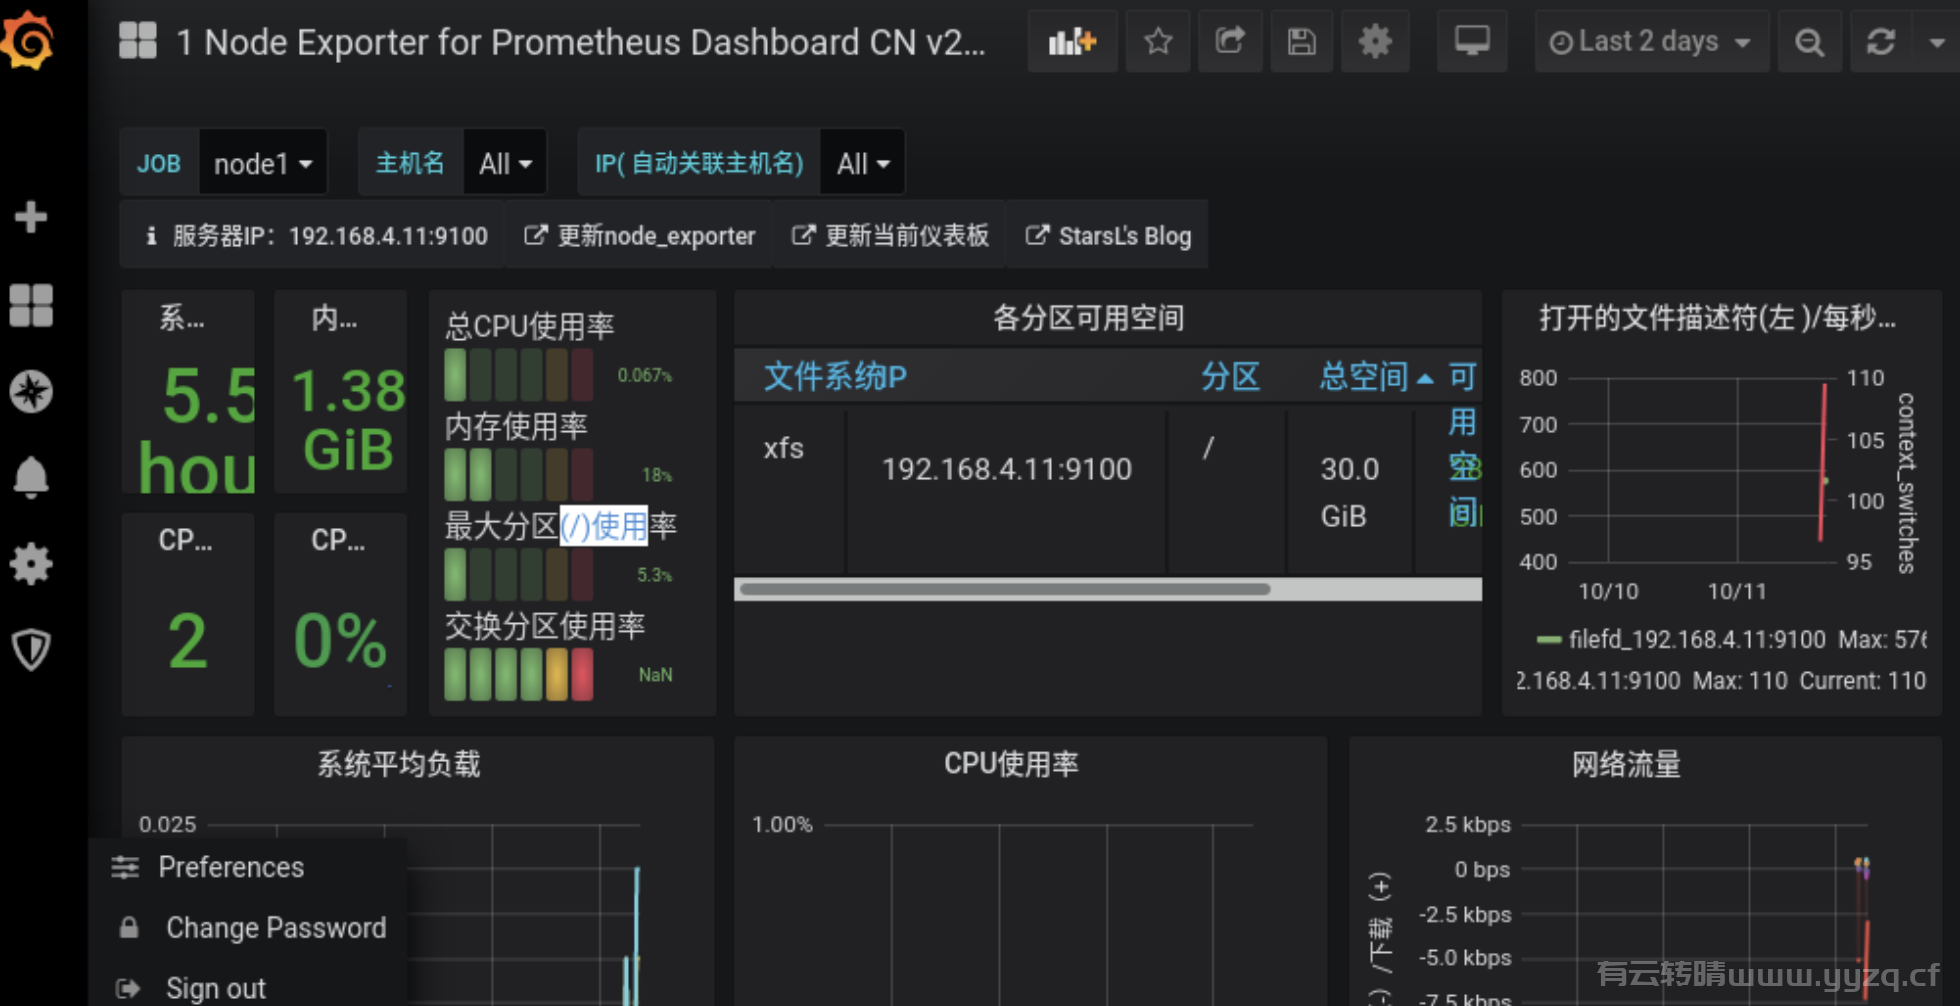
展示node1的监控信息
grafana模板下载:https://grafana.com/grafana/dashboards/
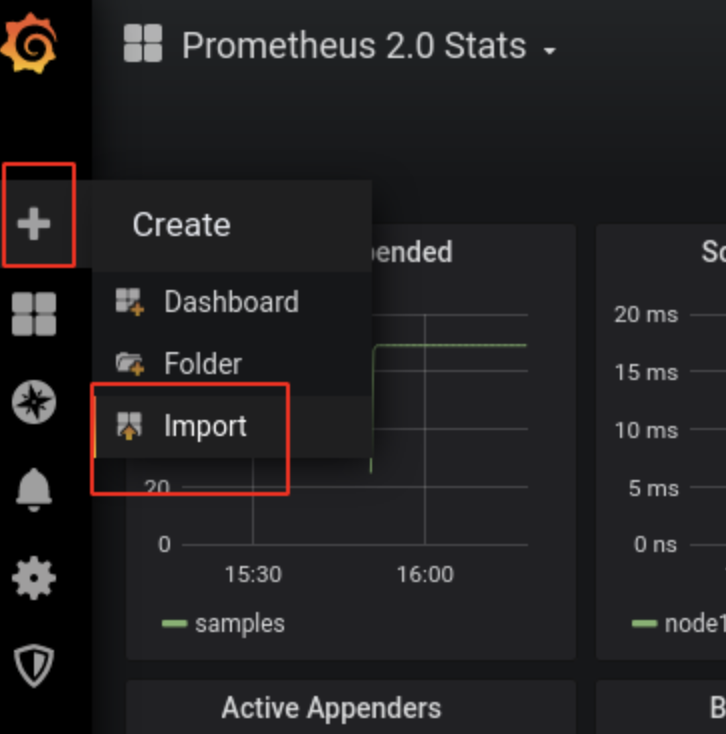
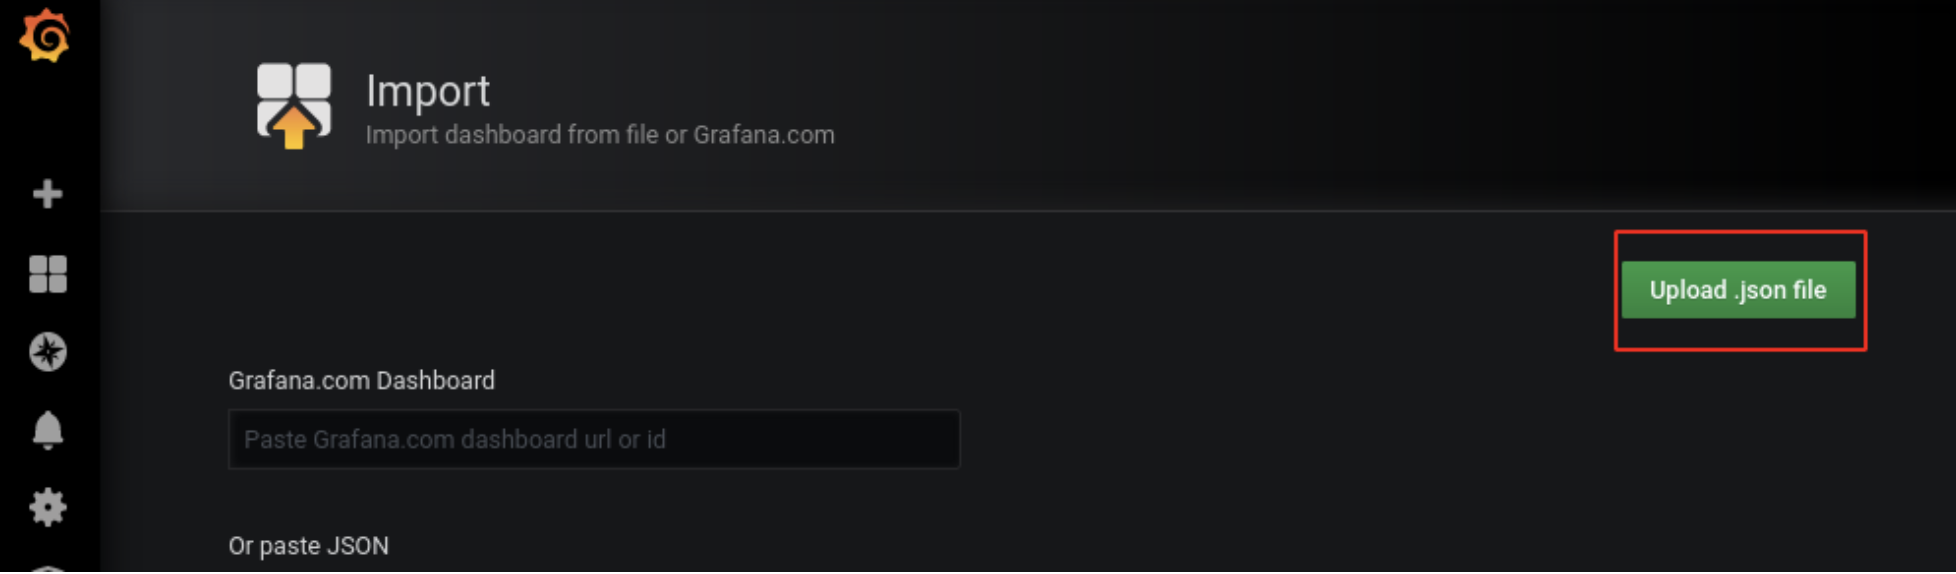
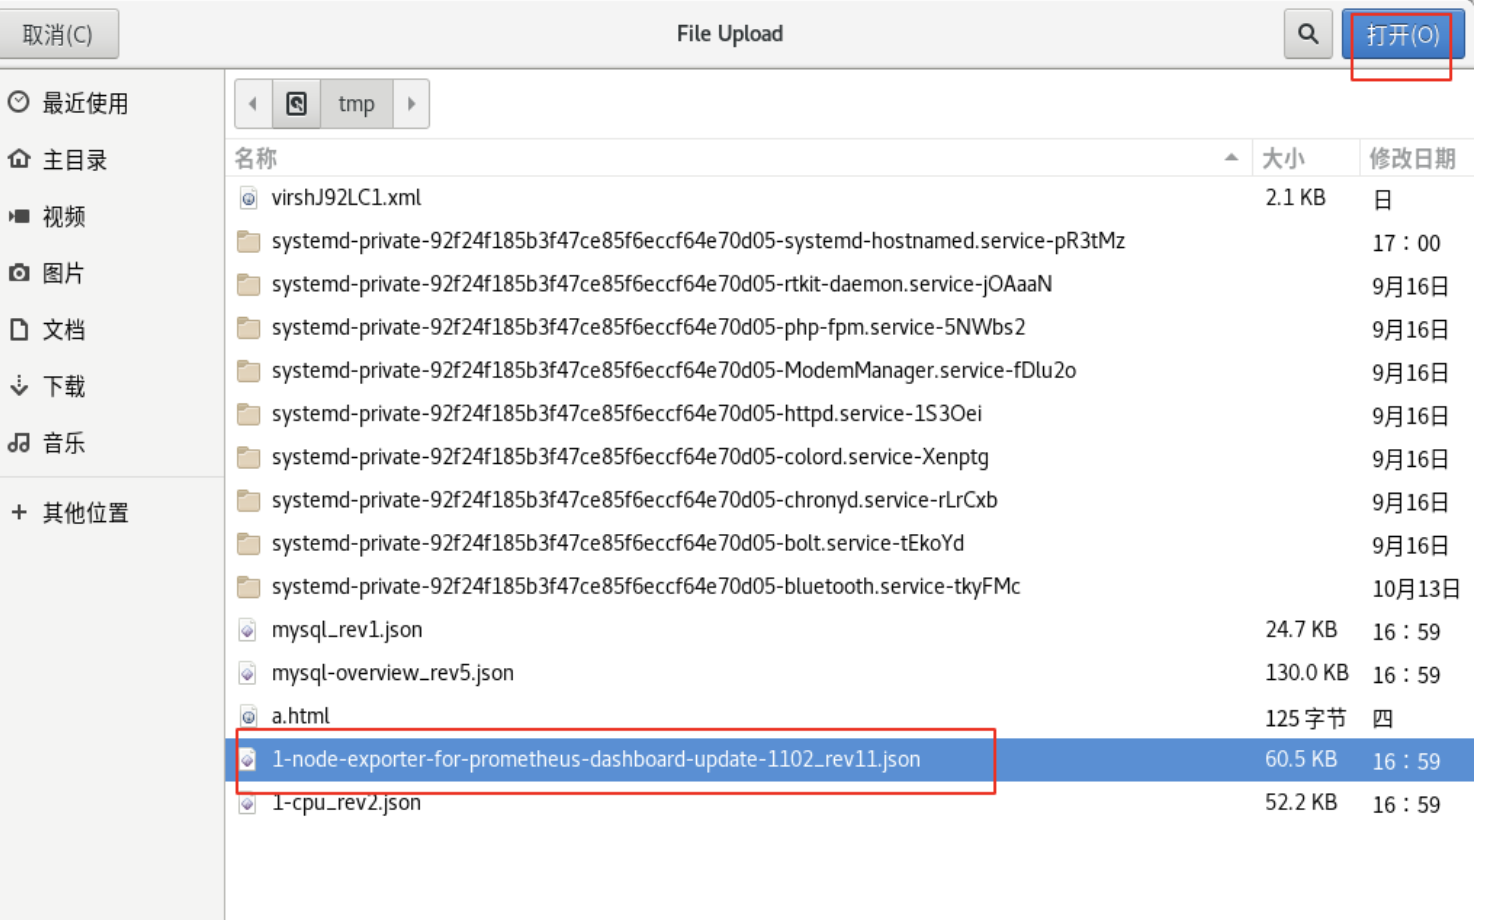
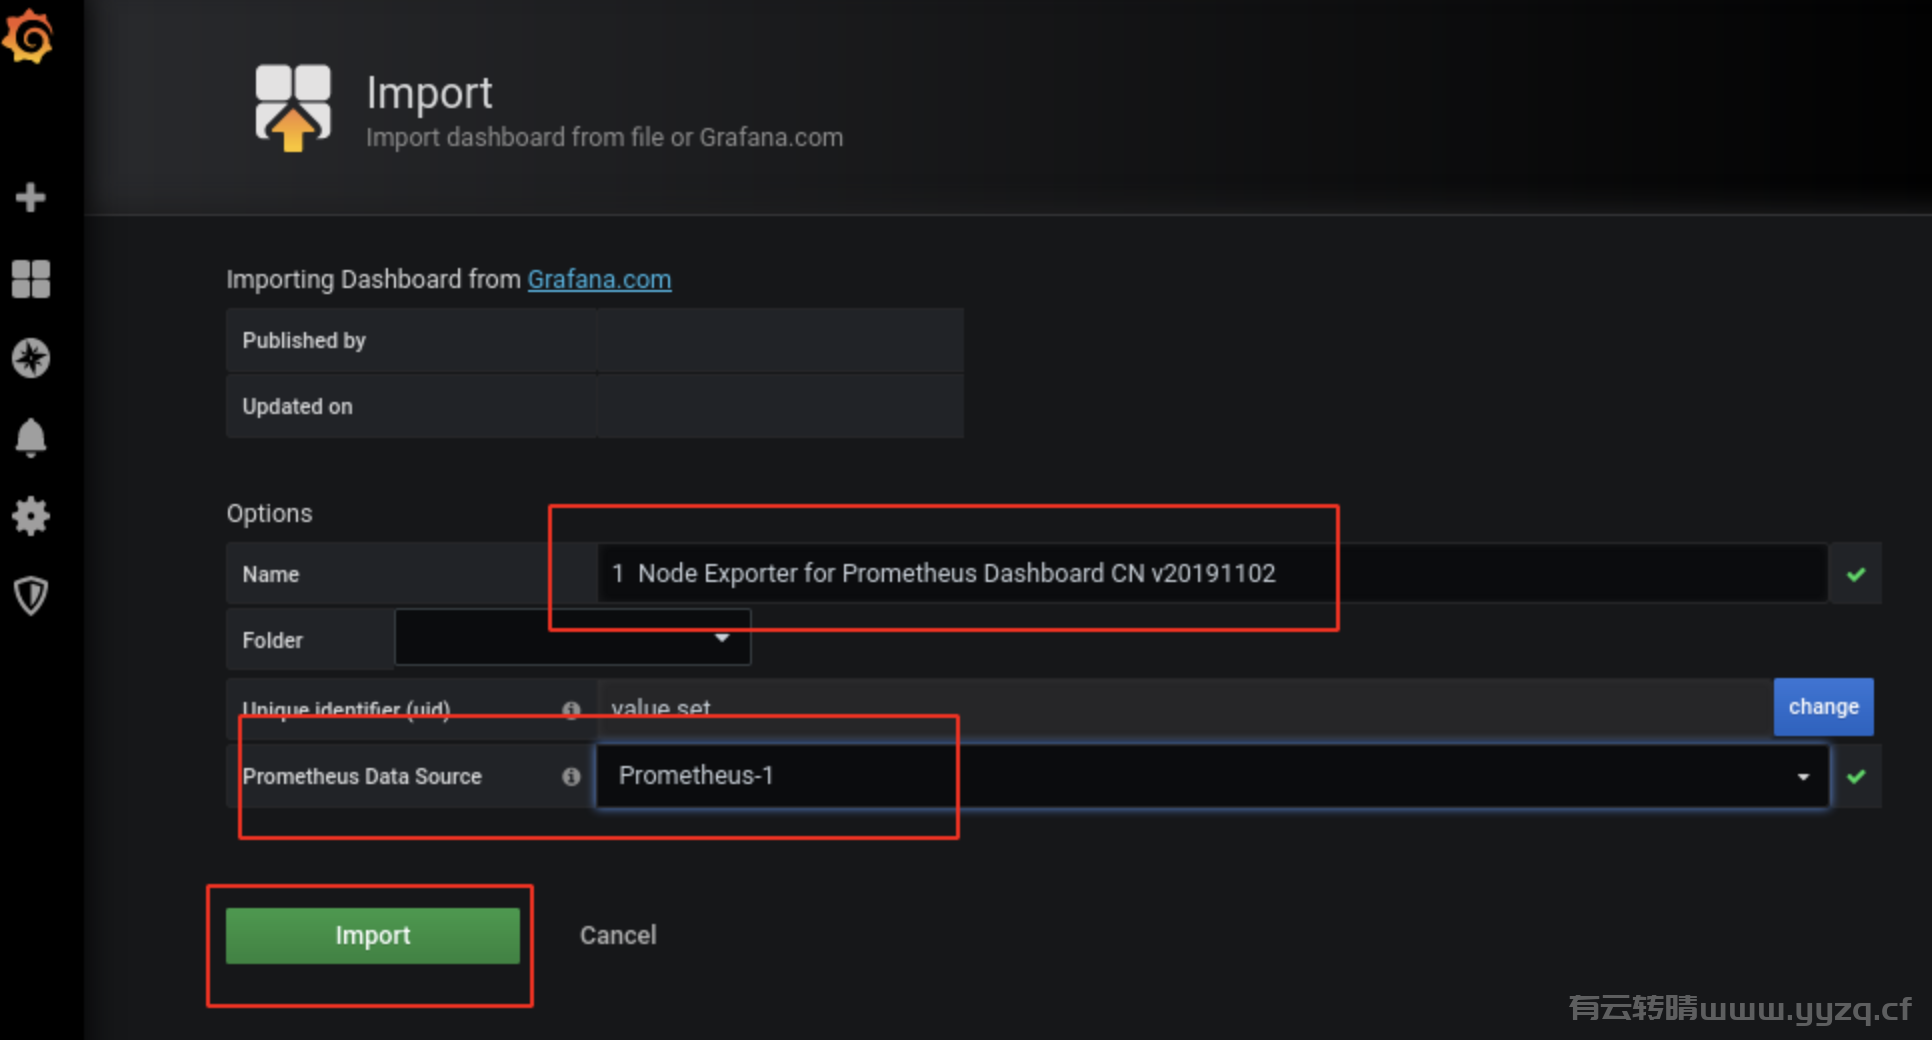
导入主机监控模板
# 把模板json文件拷贝到浏览器所在主机
[root@prometheus prometheus_soft]# scp *.json 192.168.4.254:/tmp/
监控mariadb数据库
在node1节点上安装数据库
[root@node1 ~]# cat /etc/yum.repos.d/local.repo
[local_repo]
name=CentOS-$releasever - Base
baseurl=ftp://192.168.4.254/centos-1804
enabled=1
gpgcheck=0
[root@node1 ~]# yum install -y mariadb-server
[root@node1 ~]# systemctl enable mariadb --now
在node1上安装mysql exporter
mysql exporter需要访问数据库,所以需要在数据库中为exporter创建授权用户
[root@node1 ~]# mysql
MariaDB [(none)]> grant all on *.* to jerry@'localhost' identified by '123';    # 创建用户jerry,密码是123
MariaDB [(none)]> exit
配置mysql exporter
[root@prometheus prometheus_soft]# scp mysqld_exporter-0.12.1.linux-amd64.tar.gz 192.168.4.11:/root/
[root@node1 ~]# tar xf mysqld_exporter-0.12.1.linux-amd64.tar.gz
[root@node1 ~]# mv mysqld_exporter-0.12.1.linux-amd64 /usr/local/mysqld_exporter
# 编写用于连接mysql服务的配置文件
[root@node1 ~]# vim /usr/local/mysqld_exporter/.my.cnf
[client]
host=127.0.0.1
port=3306
user=jerry
password=123
# 创建service文件
[root@node1 ~]# vim /usr/lib/systemd/system/mysqld_exporter.service
[Unit]
Description=node_exporter
After=network.target
[Service]
ExecStart=/usr/local/mysqld_exporter/mysqld_exporter \
--config.my-cnf=/usr/local/mysqld_exporter/.my.cnf
[Install]
WantedBy=multi-user.target
# 启服务
[root@node1 ~]# systemctl daemon-reload
[root@node1 ~]# systemctl enable mysqld_exporter.service --now
[root@node1 ~]# ss -tlnp | grep :9104
LISTEN     0      128         :::9104
配置prometheus监控mysql
# 修改配置文件,追加以下内容:
[root@prometheus ~]# vim /usr/local/prometheus/prometheus.yml
  - job_name: 'mysql'
    static_configs:
    - targets: ['192.168.4.11:9104']
[root@prometheus ~]# systemctl restart prometheus.service
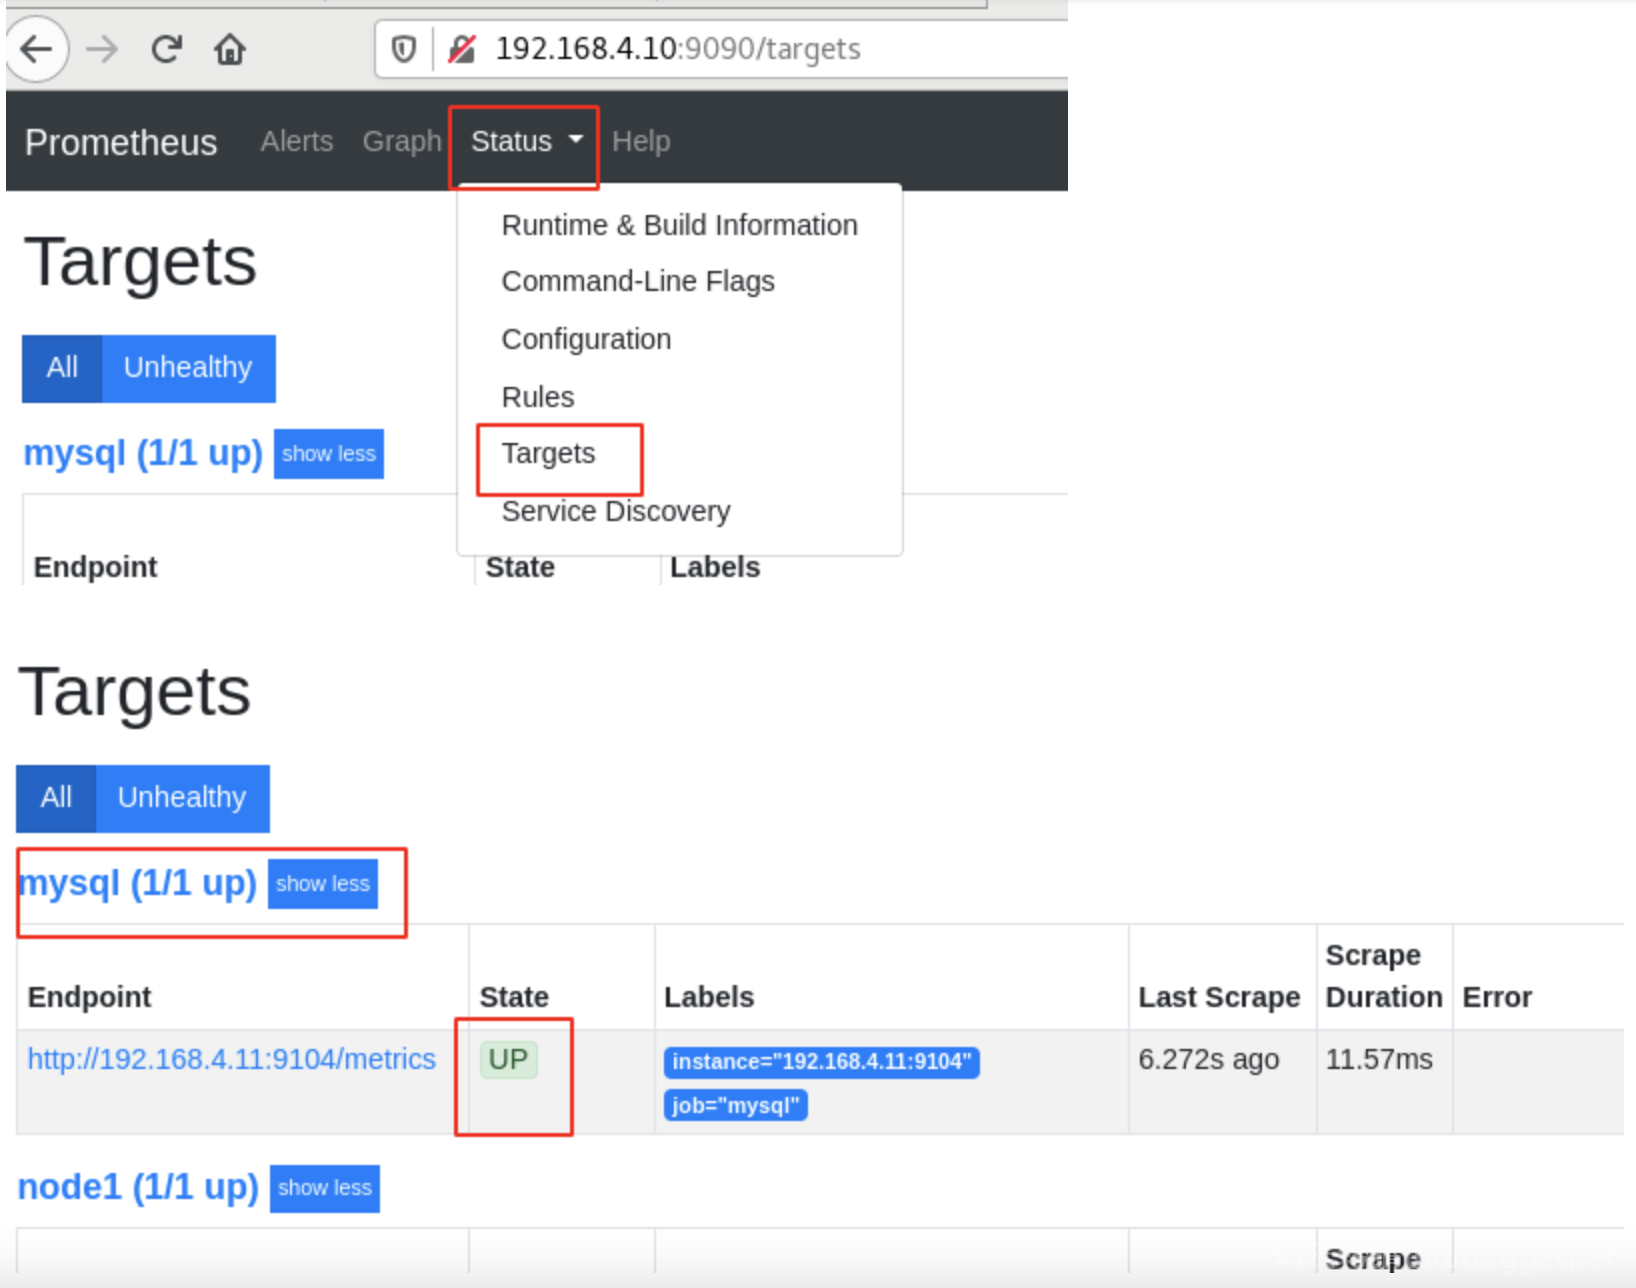
查看状态:
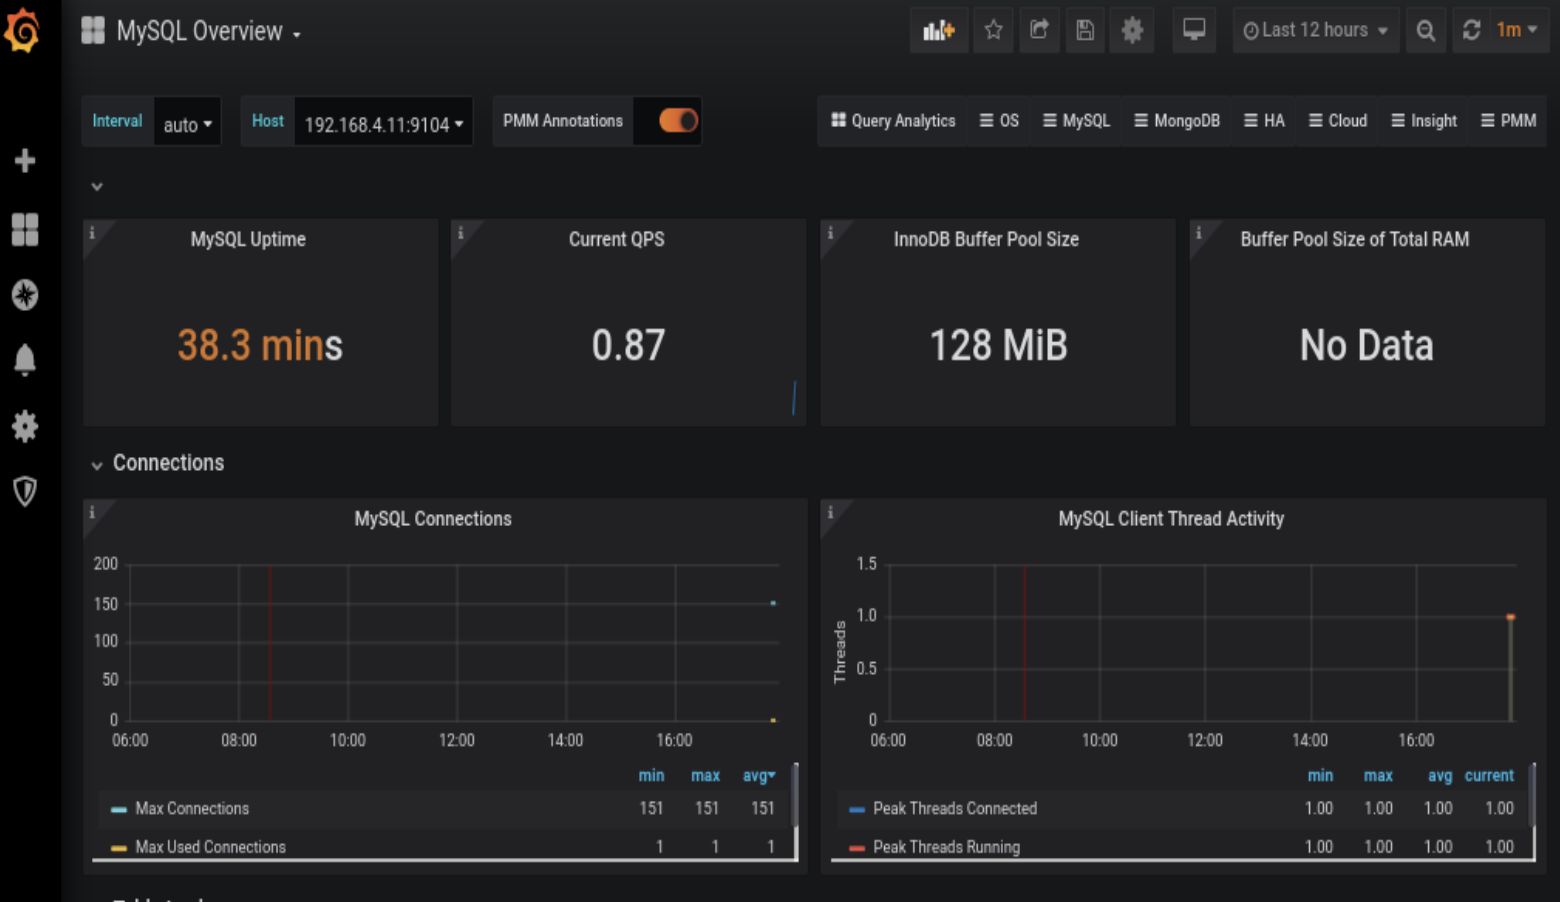
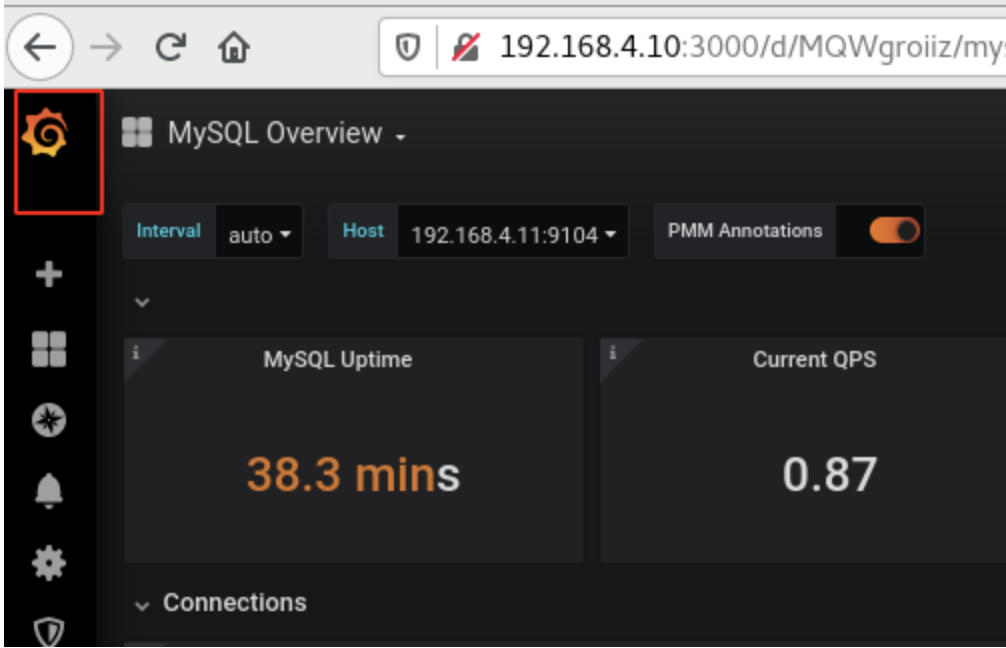
在grafana中展示mysql exporter数据
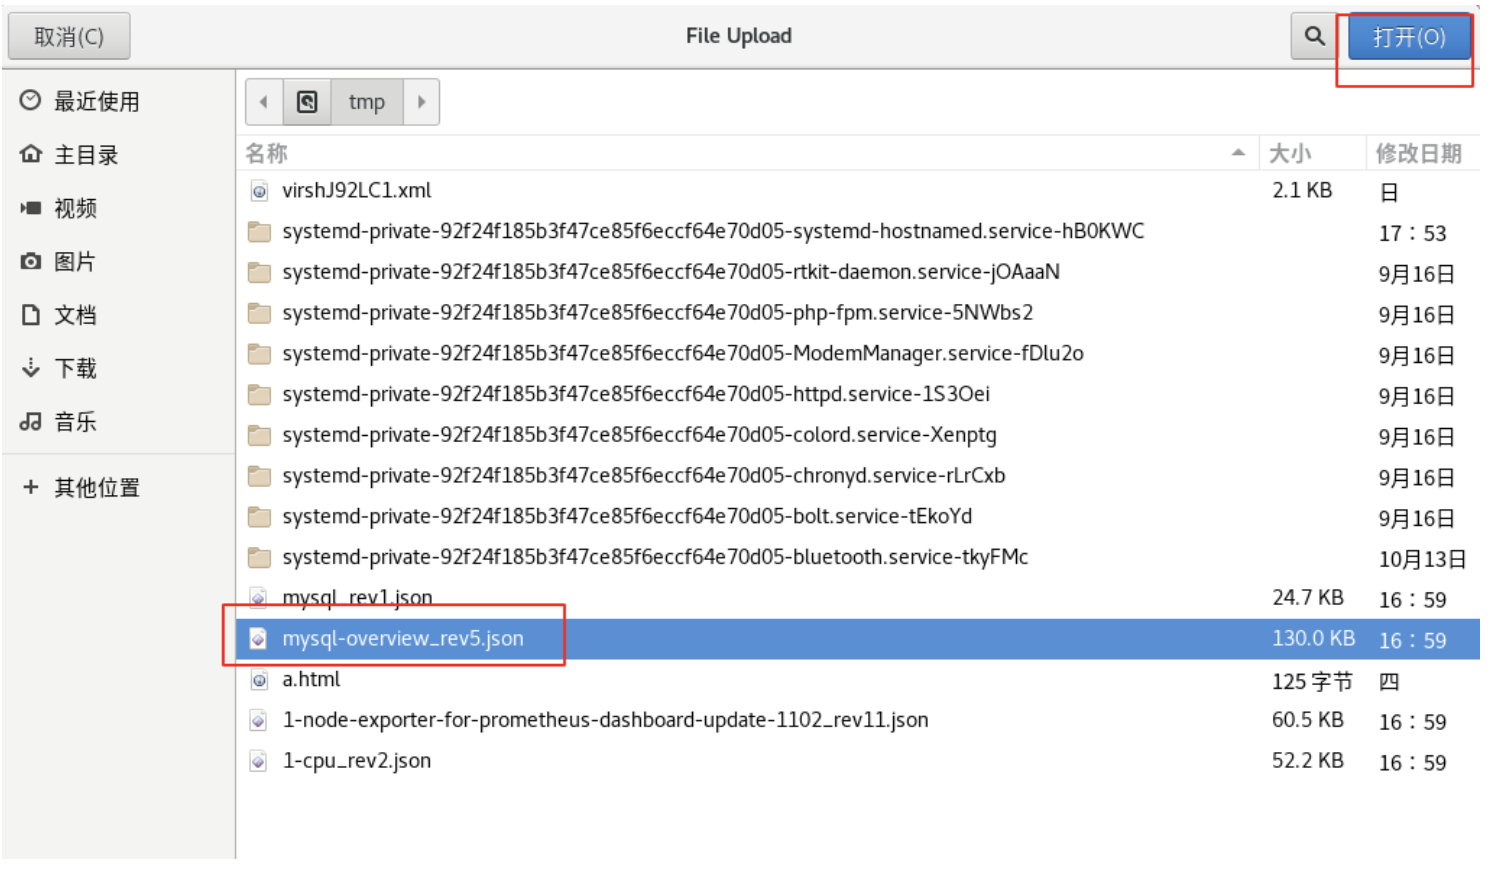
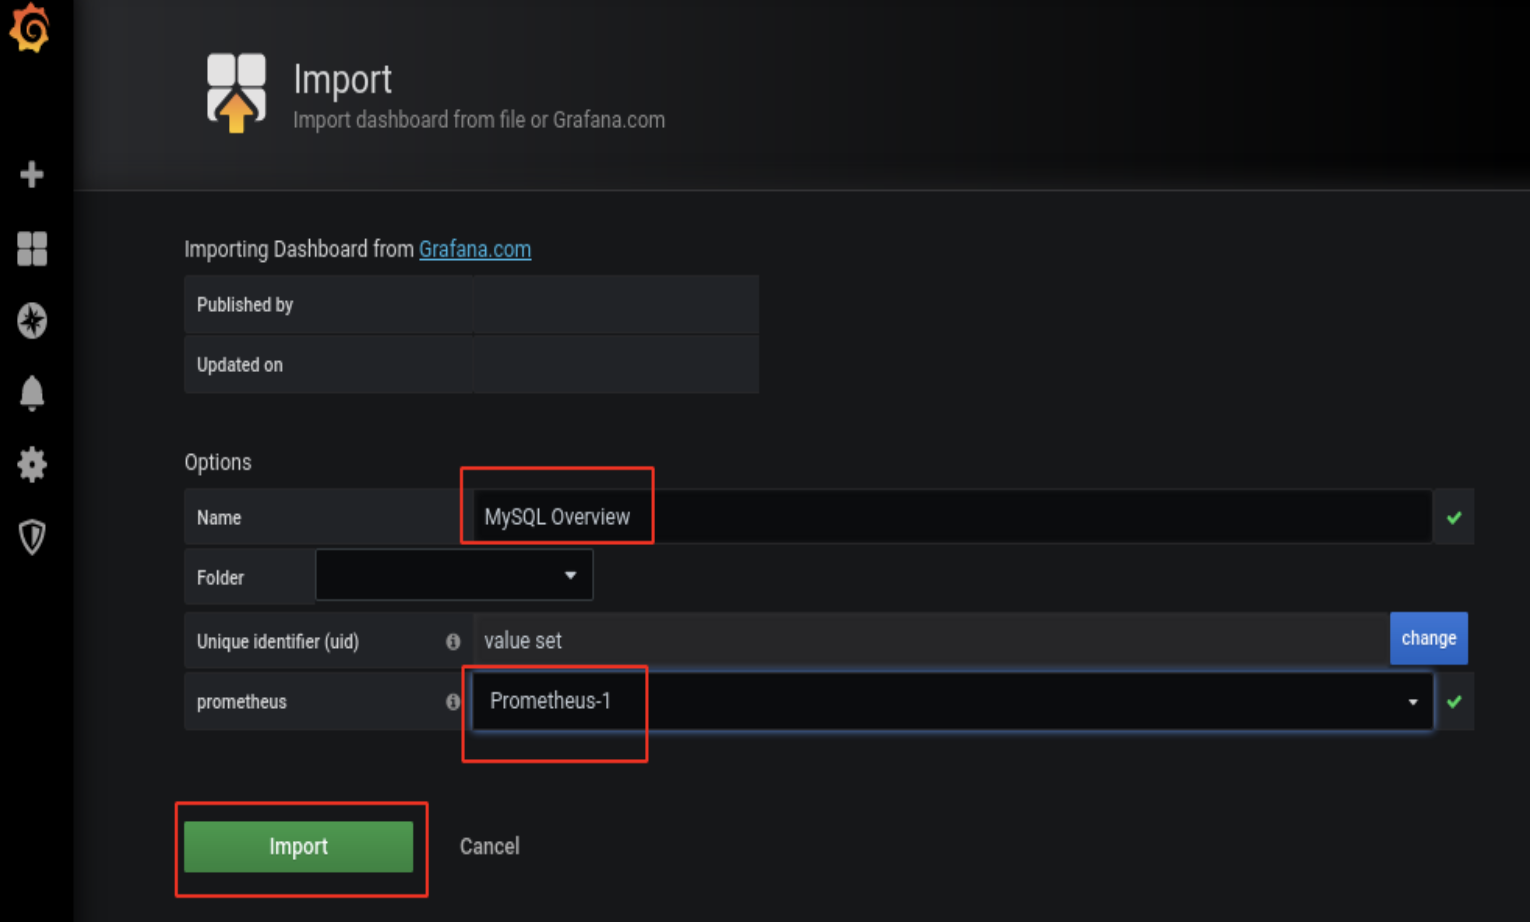
模板切换
查看其模板:
over


发表评论